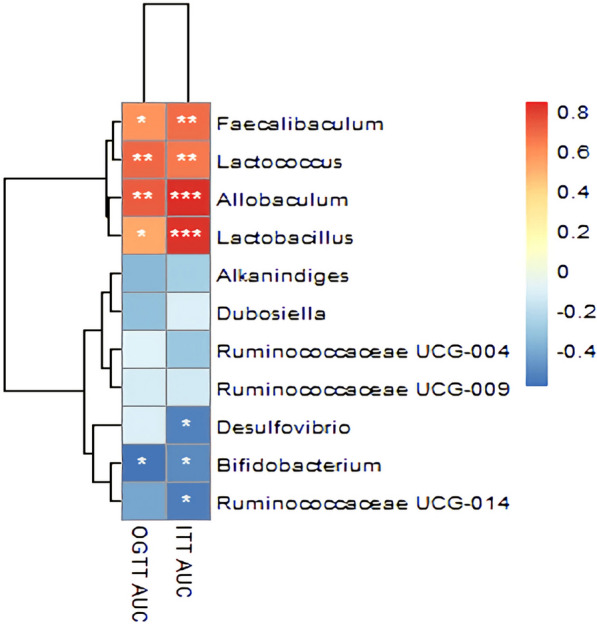
Fig. 17.

Correlation Analysis of Gut Microbiota and Insulin resistance indicator. The Y-axis indicates the different abundance of the gut microbiota. The colors of grids indicate the correlation analysis value of spearman's correlation analysis. Grids in red represent positive correlations (correlation analysis value more than 0.1), while grids in blue represent negative correlations (correlation analysis value less than -0.1). Color coding scale represents the correlation analysis value from heatmap, the deeper red or blue indicates higher correlation values. *p< 0.05, **p< 0.01, ***p< 0.001
