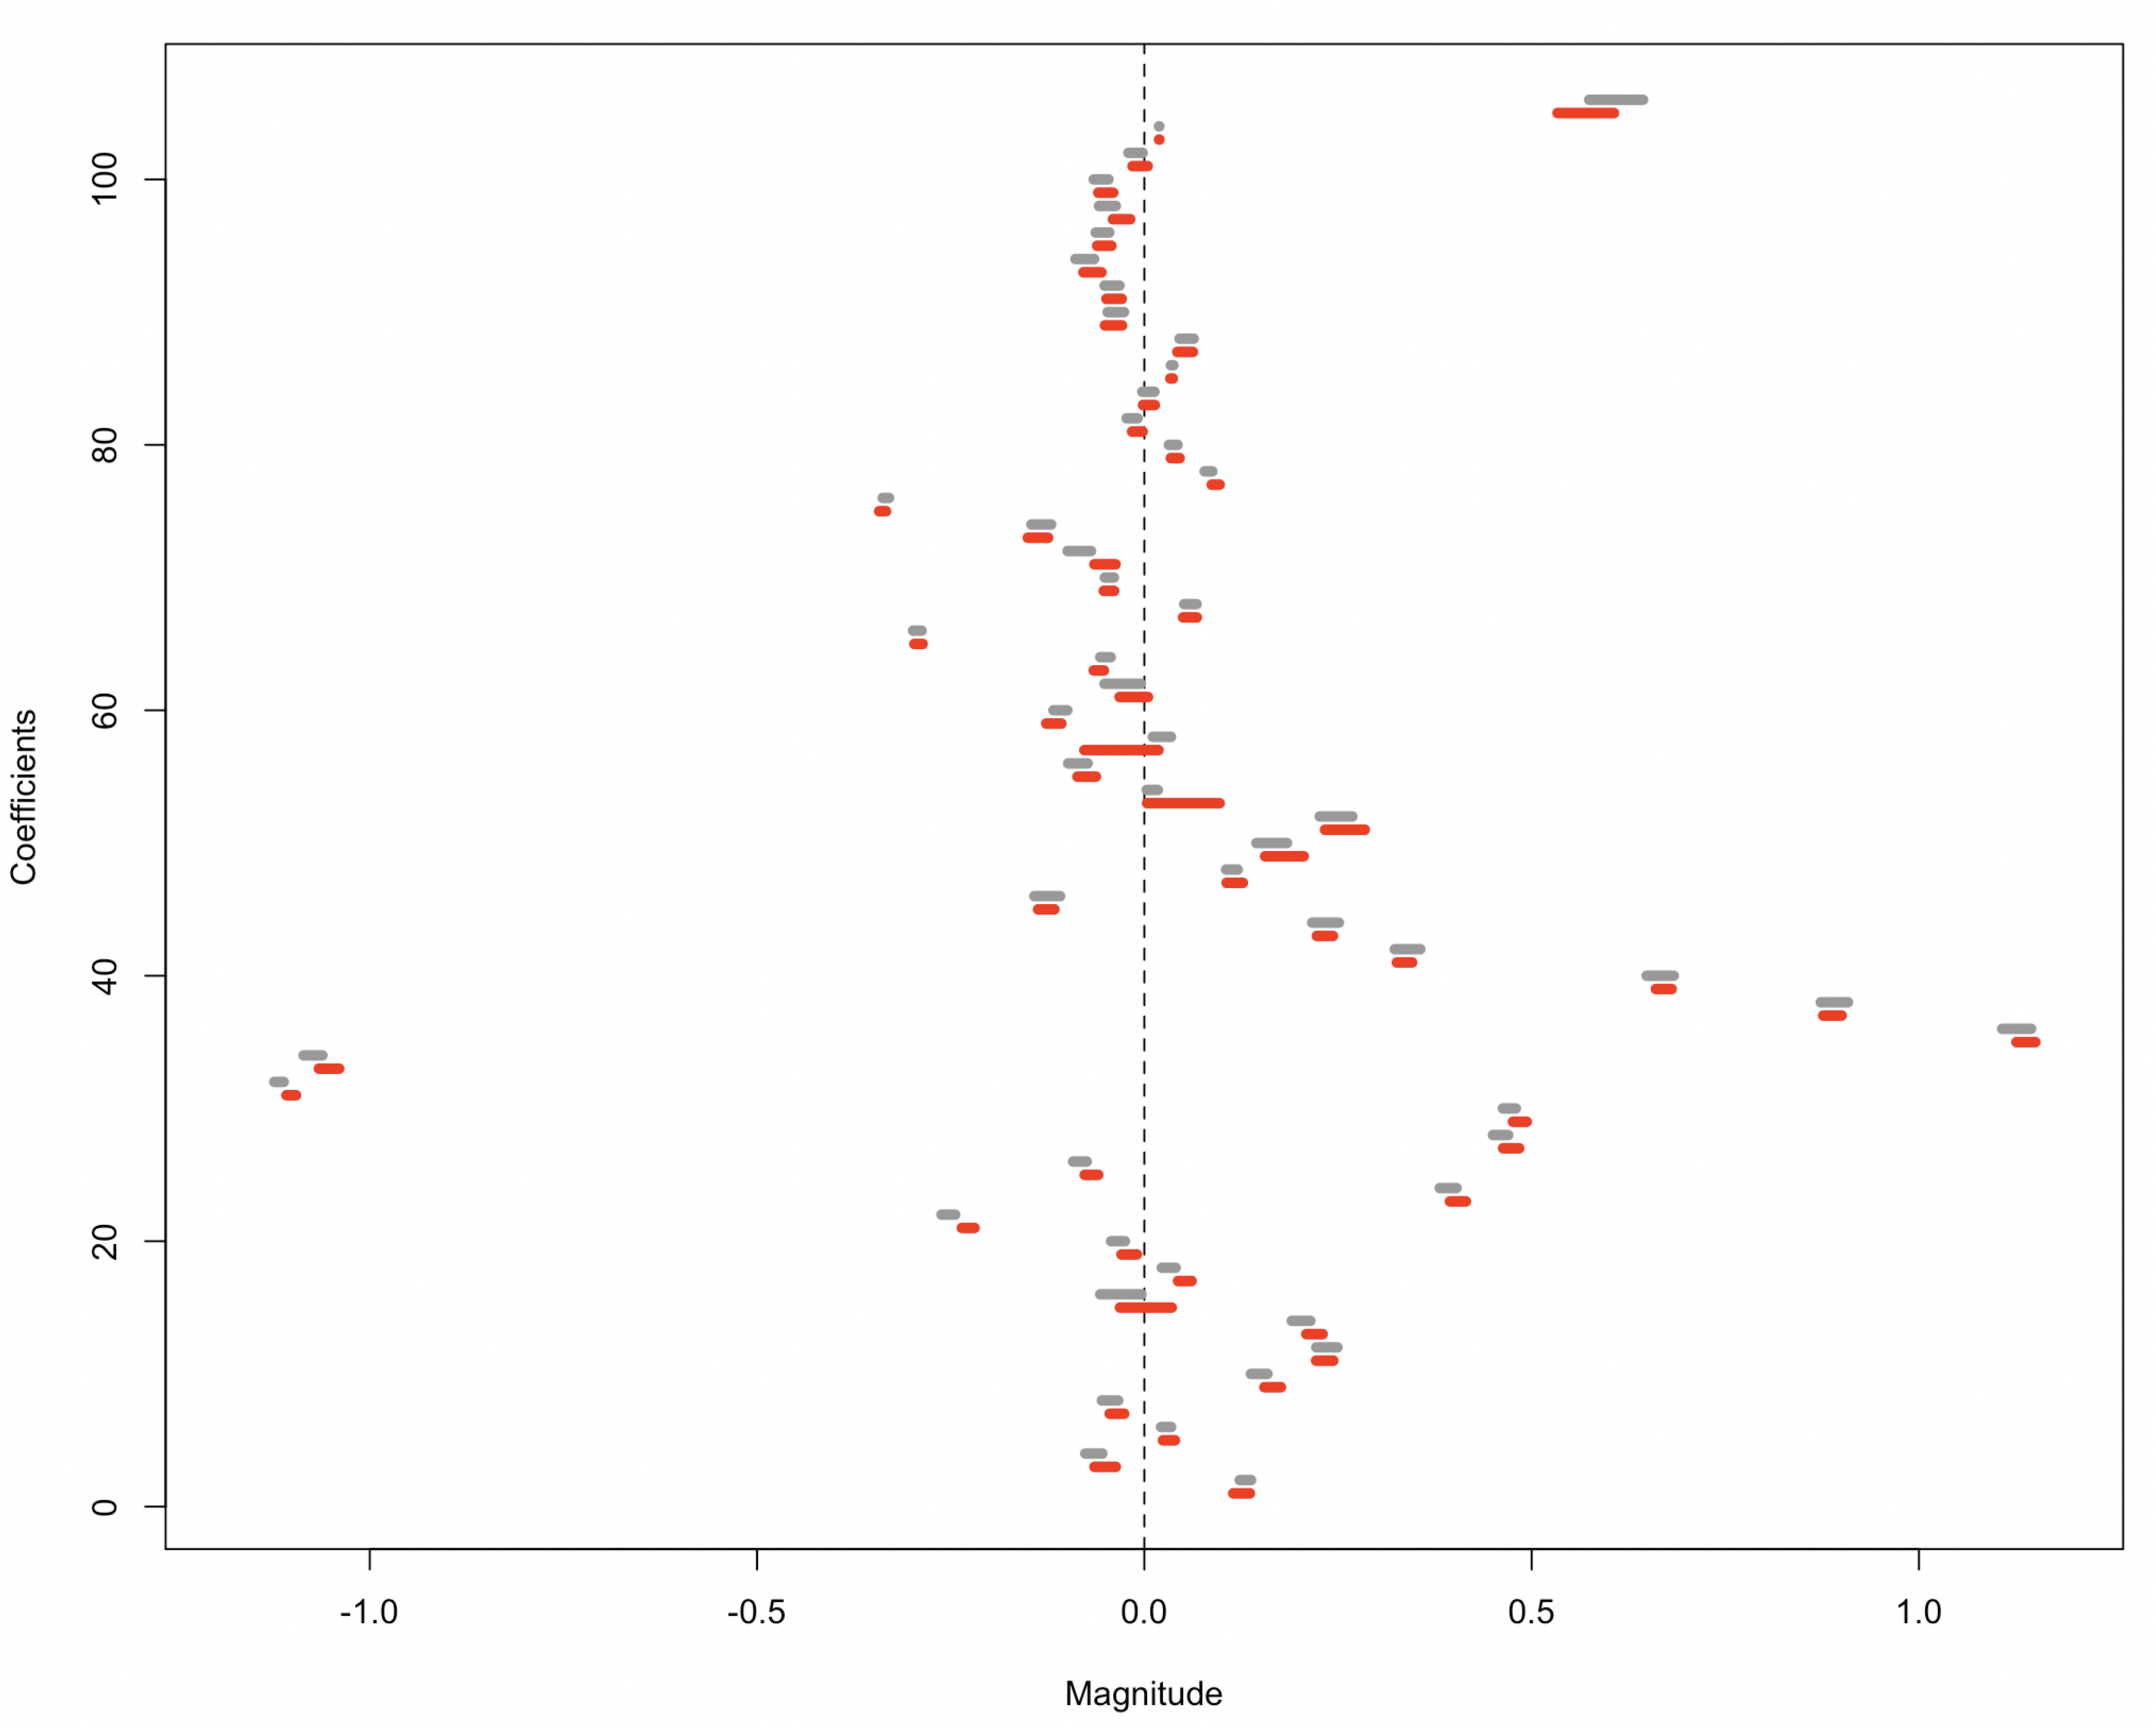
Figure 3.

Confidence intervals of regression coefficients based on raw data and privatized data, represented by gray and red lines and constructed using the data-flush scheme in Section 3. Regressors from the top to the bottom are the intercept (shifted to the left by 8 units for better visualization), AGE, REGION (8 dummy variables), METPOP10, METRO (2 dummy variables), MORTGAGE (2 dummy variables), SEX, MARST (5 dummy variables), RACE (5 dummy variables), HISPAN, SPEAKENG (2 dummy variables), HCOVANY, EDUCD (6 dummy variables), EMPSTAT (2 dummy variables), OCC (12 dummy variables), MIGRATE (2 dummy variables), and VETSTAT. The confidence intervals based on raw data are comparable with those after privatization in terms of the signs of interval centers and lengths.
