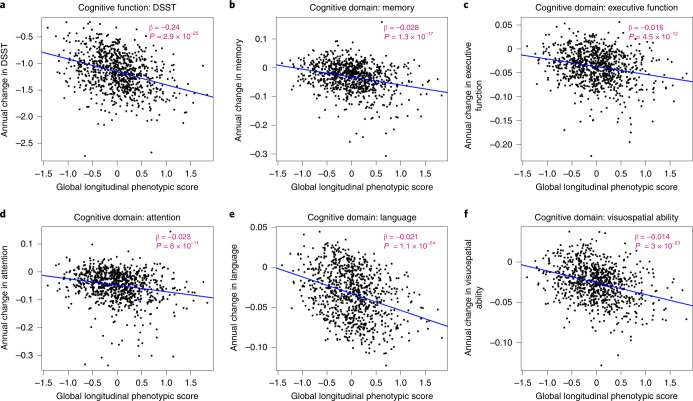
Fig. 6. Relationship between global longitudinal phenotypic score and changes in cognitive function.
a–c, Higher global longitudinal phenotypic score indicates accelerated phenotypic aging trajectories. Higher annual decreases in DSST (a), memory (b), executive function (c), attention (d), language (e) and visuospatial ability (f) indicate faster decline of cognitive function. Memory score is constructed by the average of standardized immediate recall and long-delay-free recall from the CVL test. Language score is constructed as the average of standardized letter fluency and standardized category fluency. Attention score is constructed as the average standardized log-transformed trail-making tests part A and digit span forward. Executive function is constructed by the average of standardized log-transformed trail-making tests part B and digit span backward. Visuospatial ability is calculated by standardized cart rotations test. Two-sided tests were used, and the displayed P values were not adjusted for multiple comparisons. Participants with at least two visits: DSST, n = 867; memory, n = 877; executive function, n = 894; attention, n = 894; language, n = 892; visuospatial ability, n = 878; also, see Supplementary Table 1b for more details.

