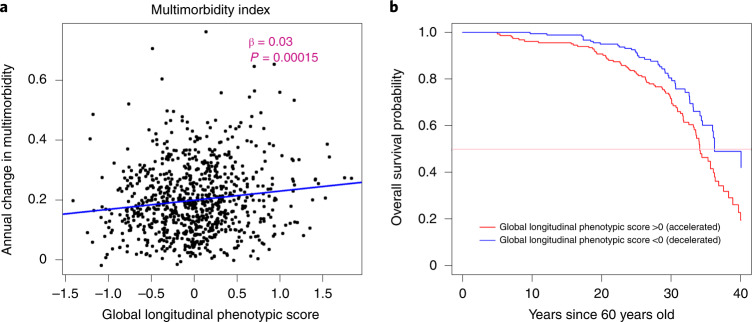
Fig. 7. Relationship of global longitudinal phenotypic score with change of multimorbidity index and survival probability.
a, Higher global longitudinal phenotypic score indicates accelerated phenotypic aging trajectories. Higher annual increase in multimorbidity indicates faster accumulation of chronic diseases. b, Among 893 participants aged >60 years during follow-up, the group with global longitudinal phenotypic score >0 (red) includes participants who experienced accelerated phenotypic aging trajectories, showing higher mortality compared with those with global longitudinal phenotypic score ≤0 (black; unadjusted time ratio (95% CI) = 0.87 (0.80, 0.95), P = 0.001, by fitting of Weibull distribution.) Two-sided tests were used, and the displayed P value was not adjusted for multiple comparisons.

