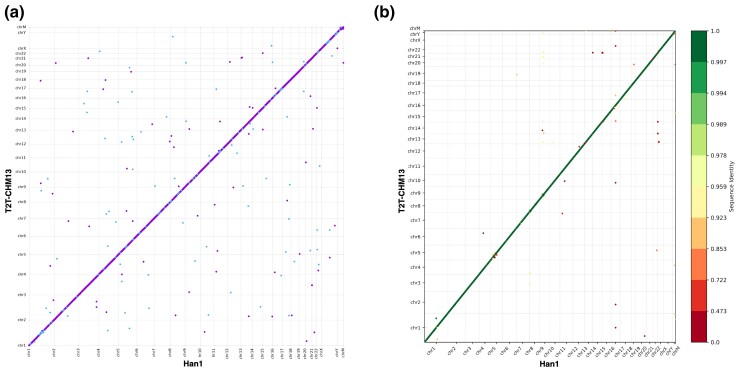
Fig. 2.
a) A dot plot between the DNA sequences of Han1 and T2T-CHM13 shows the high collinearity of every chromosome between the two genomes. The segments in purple color mean sequences in T2T-CHM13 and Han1 are in the same direction, whereas the blue color means they are in the reverse direction. b) A gene order plot, where genes were numbered from 1 to N in order along all chromosomes of both T2T-CHM13 and Han1, and color-coded according to sequence identity. For both a) and b), the axis is the T2T-CHM13 reference, and the axis is Han1. Chromosomes are in the order of 1 to 22, X, Y, and M. The alignments and dot plot were produced using the MUMmer4 software, and the gene order plot was generated by Liftofftools v0.2.0.

