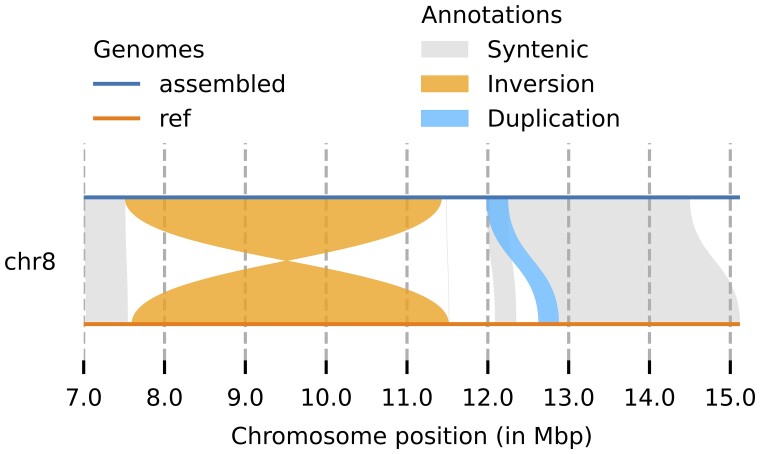
Fig. 3.
A detailed view of an inversion between Han1 (top, in blue color) and T2T-CHM13 (bottom, in orange color), spanning the region from approximately 7.5 to 11.5 Mbp on chromosome 8. Figure created with Plotsr (Goel and Schneeberger 2022) version 0.5.4.

