Fig. 3.
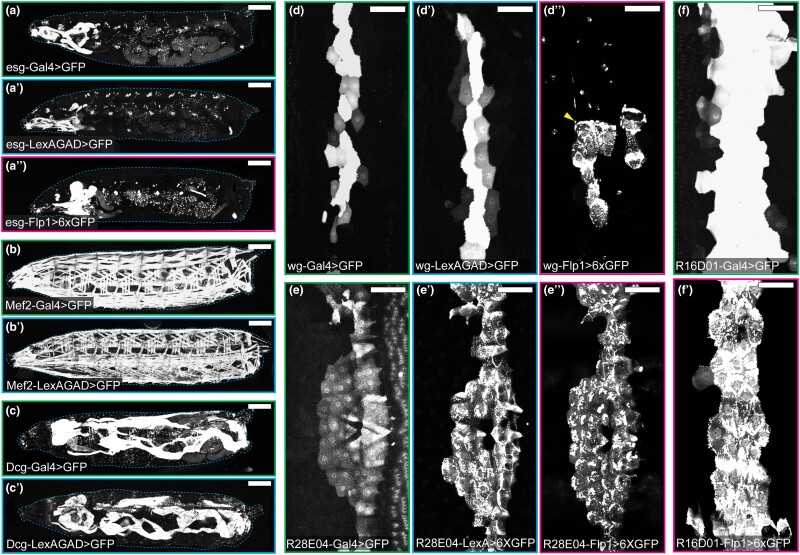
Comparison of Gal4 and converted LexA and Flp lines in non-neural tissues. a–a″) Activity patterns of esg-Gal4 (a), esg-LexAGAD (a′), and esg-Flp1 (a″) in the whole larval body. b and b′) Activity patterns of Mef2-Gal4 (b) and Mef2-LexAGAD (b′) in the whole larval body. c and c′) Activity patterns of Dcg-Gal4 (c) and Dcg-LexAGAD (c′) in the whole larval body. d–d″) Activity patterns of wg-Gal4 (d), wg-LexAGAD (d′), and wg-Flp1 (d″) in epidermal cells of a single hemisegment. Arrowhead (d″) indicates the cell body of a sensory neuron. e–e″) Activity patterns of R28E04-Gal4 (e), R28E04-LexAGAD (e′), and R28E04-Flp1 (e″) in epidermal cells of a single hemisegment. f–f″) Activity patterns of R16D01-Gal4 (f) and R16D01-LexAGAD (f′) in epidermal cells of a single hemisegment. Refer to Table 1 for reporter lines used. Scale bar: 300 μm (a–c′); 100 μm (d–f′).

