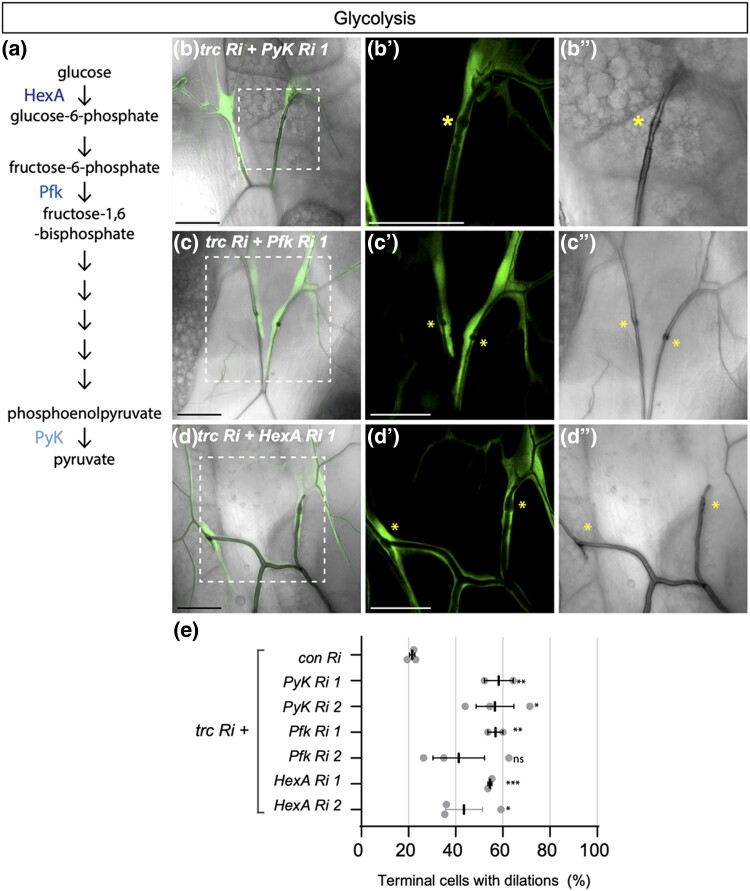
Fig. 3.
Loss of glycolysis enzymes enhances trc in terminal cells. a) Schematic of glycolysis, indicating hexokinase (HexA), phosphofructokinase (Pfk) and Pyruvate Kinase (PyK) enzymes. (B-D) Confocal images of terminal cells from third instar larvae (dorsal view) expressing drm > GFP (fluorescent signal) and the indicated RNAi transgenes. Bright field shows outline of lumen. Dashed square box indicates region that is zoomed in on the two right panels. Scale bars, 50 µM. Co-expression of trc RNAi with PyK RNAi 1 (B-B’’), Pfk RNAi 1 (C–C’’) or HexA RNAi 1 (D–E’’) enhanced dilation rate in terminal cell transition zone (asterisk) compared with trc RNAi alone (Fig. 1d). e) Quantification of the number of terminal cells with dilations. Indicated RNAi lines are expressed by drm > GFP. Mean +/− SEM shown. Genotypes and number of terminal cells assessed (n value): trc Ri + control Ri, n = 27, 36, 26; trc Ri + Pyk Ri 1, n = 26, 29, 23; trc Ri + Pyk Ri 2, n = 47, 37, 56; trc Ri + Pfk Ri 1, n = 30, 82; trc Ri + Pfk Ri 2, n = 53, 43, 40; trc Ri + HexA Ri 1, n = 38, 69; trc Ri + HexA Ri 2, n = 71, 65, 50. Bars represent mean +/− SEM. An unpaired two-sided Student's t-test was used to determine statistical significance between trc Ri + con Ri control and trc Ri + additional RNAi experimental genotypes, * P-value <0.05, ** P-value <0.01.

