FIGURE 4.

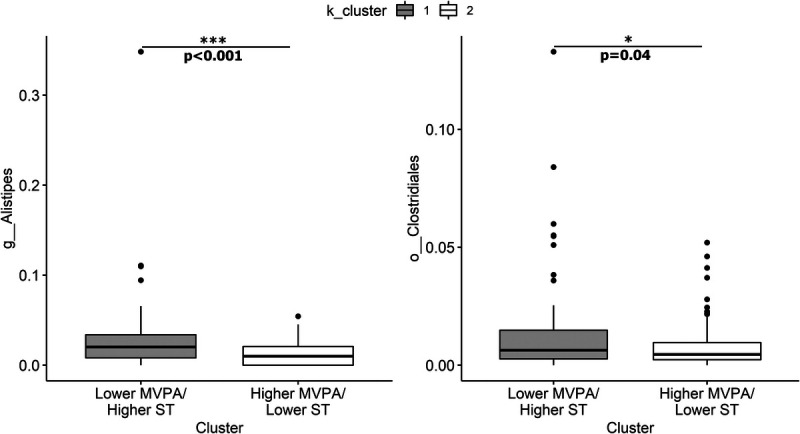
K-means cluster DESeq2 comparison. DESeq2 identified two taxa, Alistipes and Clostridiales, that were significantly different between clusters. Relative abundance of taxa displayed as proportions.

K-means cluster DESeq2 comparison. DESeq2 identified two taxa, Alistipes and Clostridiales, that were significantly different between clusters. Relative abundance of taxa displayed as proportions.