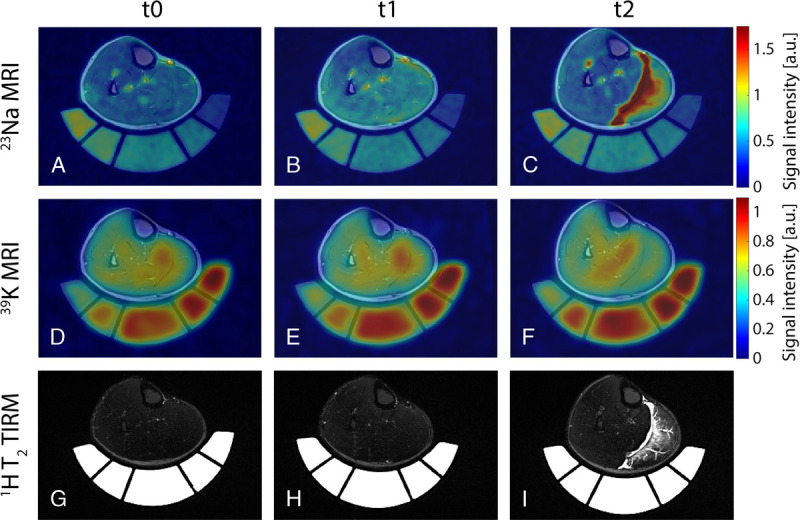
FIGURE 4.

Axial view of 23Na (A–C) and 39K (D–F) MRI scans overlaid to corresponding 1H T1 TSE image, together with T2 TIRM 1H images (G–I) of a male subject (age 20 years) with a high increase in blood serum CK (CKt2 = 55·CKt0). In this subject, T2 TIRM 1H MRI scans revealed strong intramuscular edema 48 hours after exercise (t2) with affection of the fascia and fluid accumulation within the fascial layers. Although evolution of the 23Na/39K signal intensity directly after exercise was comparable to the subject shown in Figure 3, the 23Na concentration was highly increased in GM/GL at t2 (increase by 146%/66%). Particularly, regions of strongly elevated 23Na MR signal corresponded to areas of intramuscular edema as indicated by the 1H T2 TIRM images. Simultaneously, these regions showed a reduced 39K MR signal (20% reduction in TPC in GM at t2 compared with t0).
