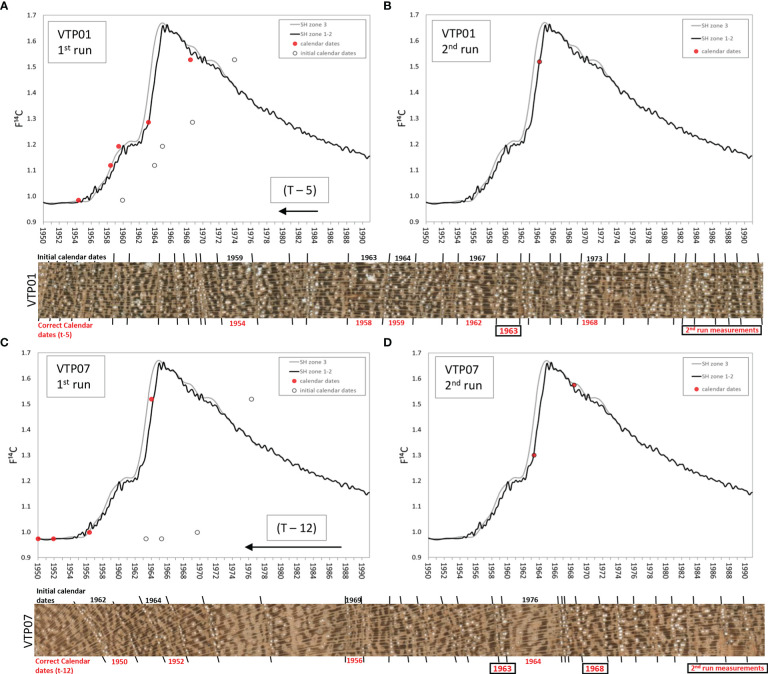
Figure 5.
Radiocarbon test results of two sample trees [VTP01 (A, B) and VTP07(C, D)] before and after wood anatomy ring boundary analysis. Lines represent the calibration radiocarbon curve for the South Hemisphere while dots show single tree ring radiocarbon values (black circles show expected year values after classical crossdating and red dots represent actual calendar date values). Horizontal images show the original prepared wood material used for crossdating with the calendar dates assigned before the wood anatomy analysis (black) and after (red).

