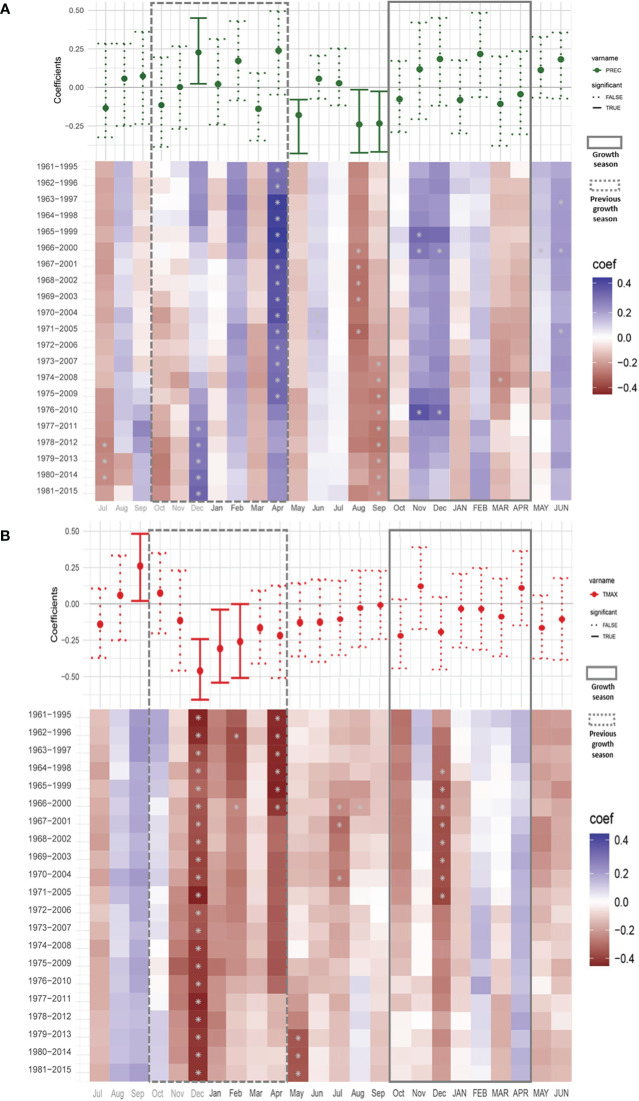
Figure 6.
Climate–growth correlations between tree ring width and monthly climatic variables [Precipitation (A) and Tmax (B)] in N. alba. Correlations were calculated for a 24 months period starting in July before the onset of the previous growing season to June after the offset of the target growing season. Simple correlations are shown in a whisker format above a color matrix showing the dynamic correlations. Previous growing season is shown inside a discontinuous line rectangle (Oct – Apr) and the target growing season is surrounded by a continuous line rectangle (Oct – APR). Significance values where set at P< 0.05. Study period 1960-2015. *significant value.

