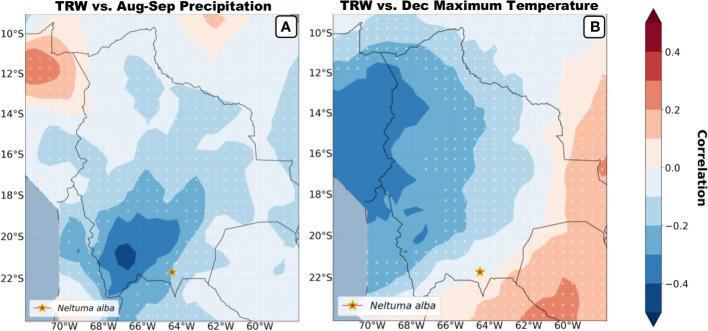
Figure 8.
Spatial correlations (1960-2015) of mean tree ring width vs. precipitation and maximum temperatures is plotted based on the highest seasonal correlations shown in figure 7. Correlations were performed using CRU TS4.06 Precipitation during the period July to September (A) and CRU TS4.06 Tmax during the month of December (B) both covering the period previous to the growing season. The red star signals the sampling site of the studied species and the white dotted background fillings signal non-significant spatial correlations. *Location of our site.

