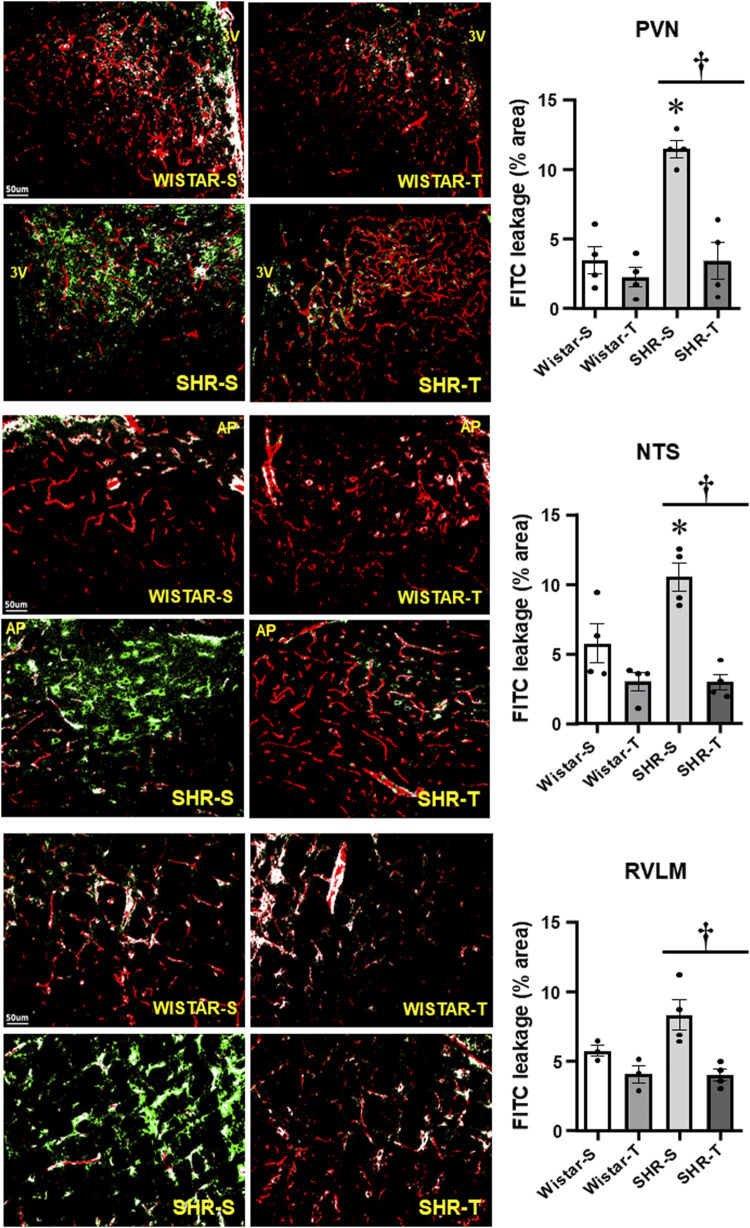
FIGURE 1.
Comparison of BBB permeability within the PVN, NTS, and RVLM of sedentary (S) and trained (T) SHR and Wistar rats. Left photomicrographs show the capillary network (Rhodamine-70kDa, red), the FITC-10kDa leakage (green) into the brain parenchyma and the colocalization of both inside capillaries (white) within the three autonomic areas. Scale bars = 50 μm. Right bar graphs depict the effects of hypertension and exercise training on the BBB leakage into the PVN, NTS and RVLM. Values are means of 5-7 slices/area/rat, 3-4 rats/group. Comparisons made by 2-way factorial ANOVA. PVN: group F (1,12) = 23.57, p < 0.001, condition F (1,12) = 23.98, p < 0.001, group x condition F (1,12) = 13.06, p = 0.004; NTS: group F (1,12) = 5.96, p = 0.031, condition F (1,12) = 28.53, p < 0.001, group x condition F (1,12) = 6.27, p = 0.028; RVLM: group F (1,10) = 3.40, p = 0.090, condition F (1,10) = 19.79, p < 0.001, group x condition F (1,10) = 3.85, p = 0.073. Significances (p < 0.05) are * vs. respective Wistar group; † vs. respective S control.

