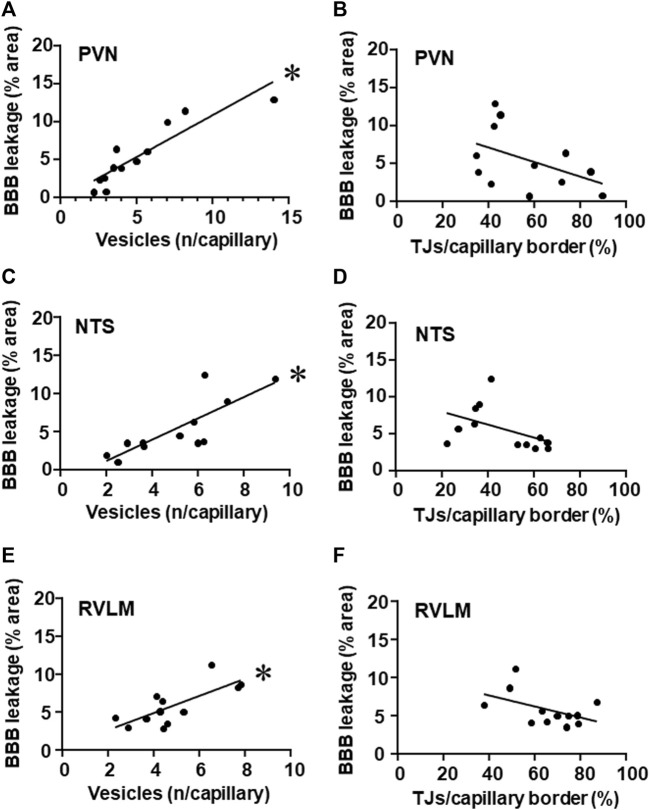
FIGURE 6.
Correlations between the number of vesicles/capillary and BBB permeability (A,C,E) and between tight junctions/capillary and BBB permeability (B,D,F) within the PVN (A,B), NTS (C,D) and RVLM (E,F) of sedentary and trained SHR and Wistar rats. BBB permeability and respective vesicles/capillary values, were obtained in 3 rats/group. Linear regression equations, correlation coefficients and p values are: PVN vesicles x BBB permeability Y = 1.10x–0.16, r = 0.905, p < 0.001; NTS vesicles x BBB permeability Y = 1.40x–1.66, r = 0.808, p = 0.002; RVLM vesicles x BBB permeability Y = 1.12x + 0.44, r = 0.743, p = 0.006; PVN TJs/capillary border x BBB permeability Y = −0.10x +10.9, r = − 0.461, p = 0.131; NTS TJs/capillary border x BBB permeability Y = −0.09x +9.7, r = −0.469, p = 0.124; RVLM TJs/capillary border x BBB permeability Y = −0.07x +10.7, r = −0.479, p = 0.229. * denotes a significant correlation.

