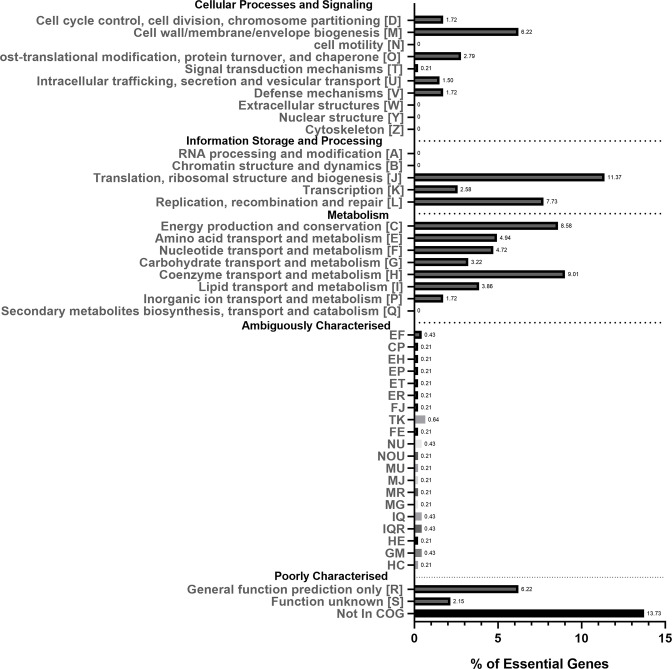
Fig. 3.
COG classification of essential genes. The x-axis shows the percentage of essential genes, and the y-axis shows COG categories. Ambiguously characterized groups show the percentage of essential genes that have been assigned to more than one COG category. The numbers next to the bars show the percentage of essential genes for that category.

