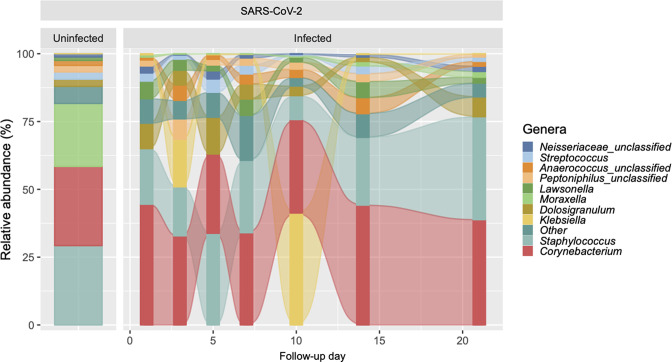
Fig. 1.
Predominant genera of the upper respiratory tract microbiota in SARS-CoV-2-uninfected and -infected participants. The figure shows alluvial plots of the relative abundance (%) of the top 10 most abundant genera (y-axis) per group and, for SARS-CoV-2-infected participants, by follow-up day (x-axis). The relative abundances of other genera were collapsed into the ‘other’ category.

