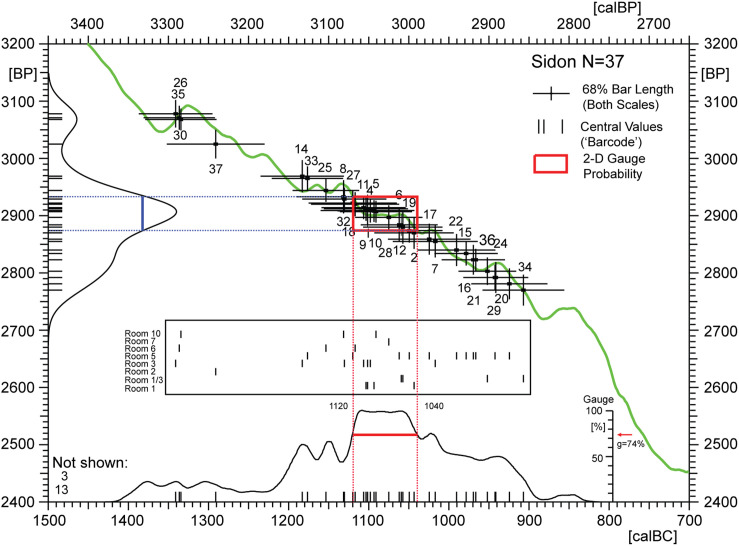
Fig 10. Overview (dispersion diagram) of radiocarbon ages from Sidon (N = 37, Table 1) showing the individual 14C-ages as calibrated crossbars with identification numbers (ID1-37).
Also shown are the 14C-histogram and the summed calibrated 14C-age probability distribution (SPD) of the total data. Calibrated median values of the single 14C ages are shown in barcode representation for total data on the calendric timescale (small vertical lines underlying the SPD envelope). In the centre of the graph the data is re-arranged according to Sidon-rooms (Room 1,1/3, 2, 3, 5, 6, 7, 10). When interpreting such diagrams it important to note that barcode ages (defined as central values of 95%-confidence intervals) are only useful for overview purposes, due to the folding properties of the 14C age calibration curve and related age-distortion (centennial-scale) of calendric ages and probability amplitudes.

