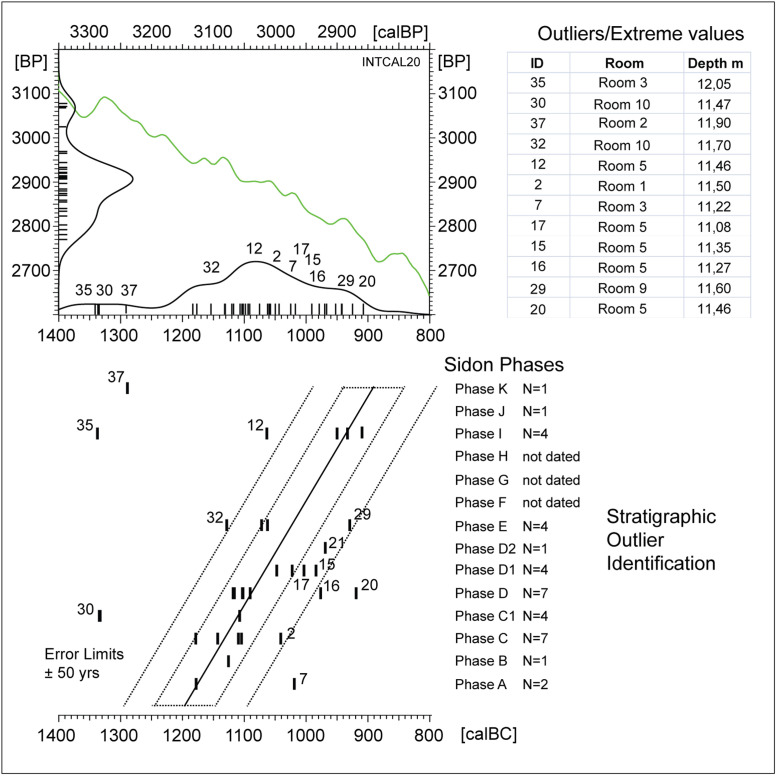
Fig 12. Identification of outliers and extreme 14C-ages based on barcode representation of Sidon data (Table 1).
In this graph all Sidon Phases (A-K) are included, with allowance for not-dated Phases F, G, and H. (Upper): 14C-histogram and calibrated probability distribution of data, numbered according to Table 1, shown in context with IntCal20 (green line). (Lower): the same data, but showing barcodes grouped according to Sidon Phase (A-K), with Phases arranged vertically according to their known stratigraphic sequence. Note, empty vertical spaces are assigned to not-dated Phases F, G, and H. This procedure, in combination with the visual setting of oblique error-lines (dashed lines drawn at ± 50yrs (~1σ) and ± 100yrs (~2σ)), facilitates first-order identification of stratigraphic outliers (sample ID: Table 1). Based on this monitoring, 14C-ages on samples with ID 7, 30, 35, 37 should be treated as outliers. Further outliers (better: extreme 14C-ages with expected modelling deviations larger than 100 calyrs) are for samples with ID 16, 20, 32, and 12. This remains to be confirmed by explicit modelling. Finally, although to smaller extent, the 14C-ages on samples with ID 2, 15, 17, 21, and 29 are also forecasted to show modelling deviations, in this case on the level of ~ 50 yrs. Of special interest is the recognition that, for the youngest Phases I, J, and K, apparently only three of the six dates (i.e. 50%) are likely to be in correct stratigraphic order, and all three of these dates are from Phase I. On the older side of the stratigraphy, with ID7 from Phase A clearly too young, there is only one remaining date for each of two earliest Phases A and B. This we judge is an insufficient number for application of advanced statistical studies.

