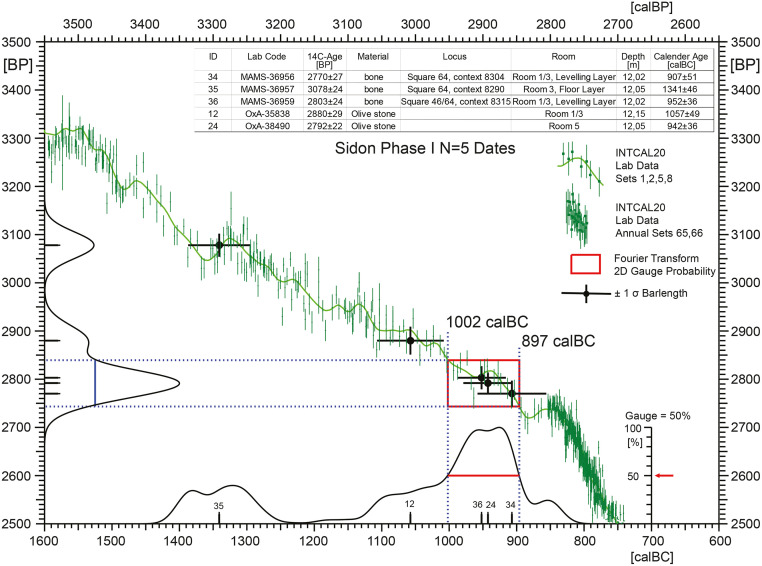
Fig 14. Application of the probability gauge method to Sidon Phase I dates, used to estimate the Begin and End of the phase.
The available N = 5 dates are shown as single-age crossbars (± 68% confidence), with sample ID according to Table 1. The red-coloured rectangle projected onto the IntCal20 curve shows the visually optimised central area of 2D-dating probability. The underlying gauge value of g = 50% was chosen in order to enclose simultaneously as much central area of the uncalibrated (14C-scale) and calibrated (calendric scale) distributions as possible. The result is that Sidon Phase I begins at 1000 ± 40 calBC and ends at 900 ± 40 calBC (rounded ages, with dating errors estimated from underlying single dates (cf. Table 1).

