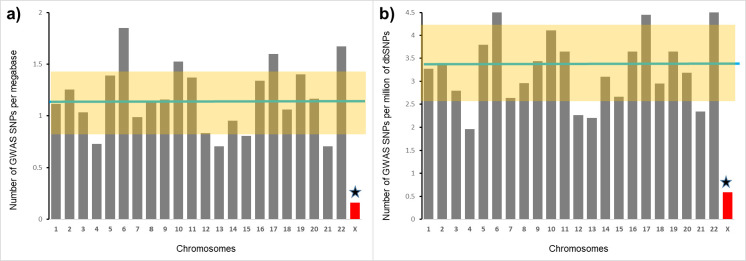
Fig 5. A comparison of X-chromosome and autosomes by the density of GWAS-detected SNPs in the female-only GWASs.
The green horizontal line is the average among all autosomes; the highlighted area represents SD for autosomes; star marks a significant difference between X-chromosome and the average for autosomes. (a) The number of female-restricted GWAS-detected SNPs per megabase. (b) The number of female-restricted GWAS-detected SNPs per million of SNPs reported by dbSNP database for a given chromosome.

