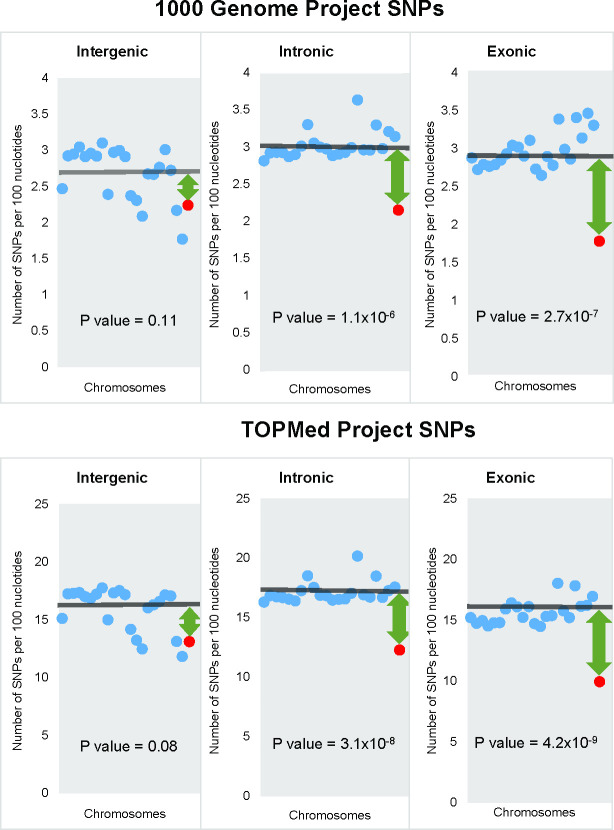
Fig 7. The densities of 1KG and TOPMed SNPs in intergenic, intronic and exonic regions.
Each dot represents a chromosome: blue dots–autosomes and red dot–X- chromosome. Horizontal lines show the mean SNP density for all autosomes. Green arrows depict the difference between the mean autosomal and X-chromosome densities. Positions of chromosomes on the Fig from left to right correspond to chromosomal numbers.

