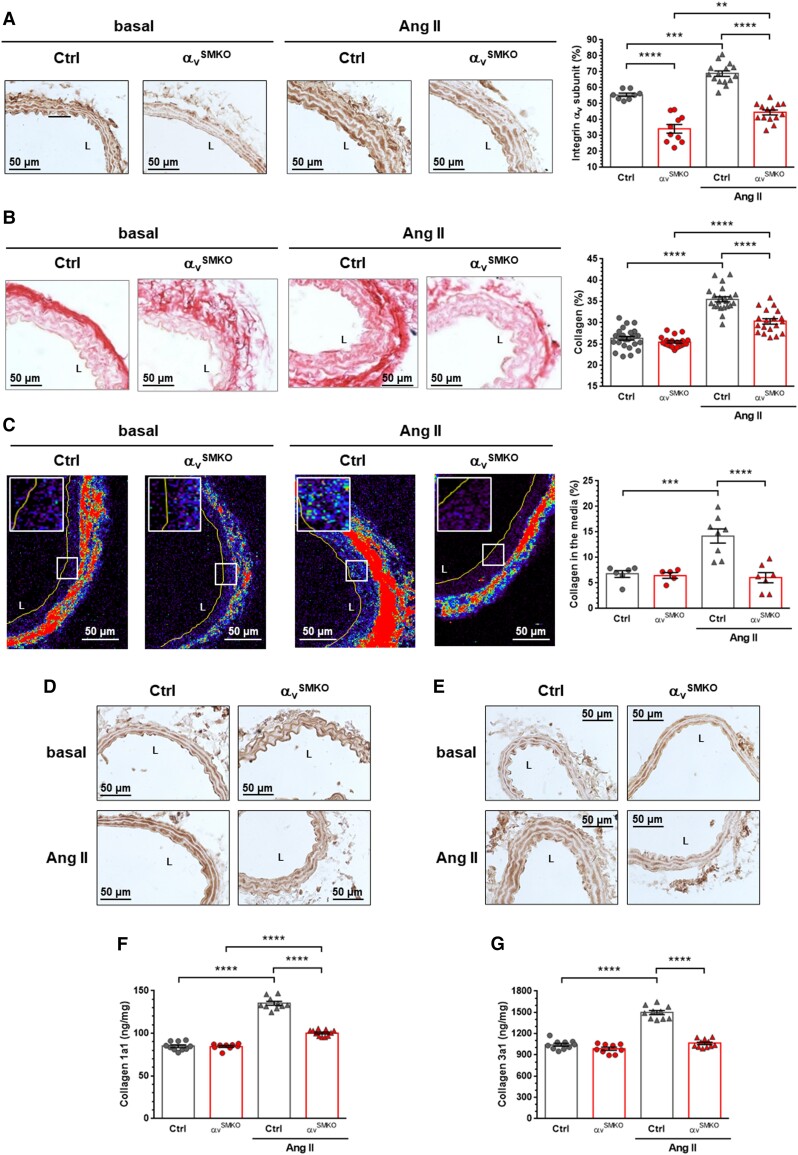
Figure 1.
Knockout of αv integrin subunit reduced collagen accumulation in response to 4-week Ang II infusion in αvSMKO mice. (A) Immunohistochemistry of the αv integrin subunit. Data are presented as mean ± SEM (n = 8-15 per group). (B) Cross sections of the carotid artery stained with Picrosirius Red to allow quantification of collagen content in the media. Representative images (magnification × 40) and quantitative data. Data are presented as mean ± SEM (n = 19–27 animals per group). L, lumen. (C) Representative SHG images of the collagen fibres and corresponding quantification of the carotid media (magnification × 40). The colour spectrum represents collagen content in media and adventitia. The line delineates the internal media layer. Boxed regions demark the position of the insets for each panel. Data are presented as mean ± SEM (n = 6–8 per group). (D–E) Immunohistochemistry of Col1a1 and Col3a1, respectively. (F–G) Quantitative expression of Col1a1 and Col3a1 (n = 9–11 per group). Two-way ANOVA followed by Tukey’s multiple comparisons test was used to analyse multiple group comparisons. **P < 0.01, ***P < 0.001, ****P < 0.0001.

