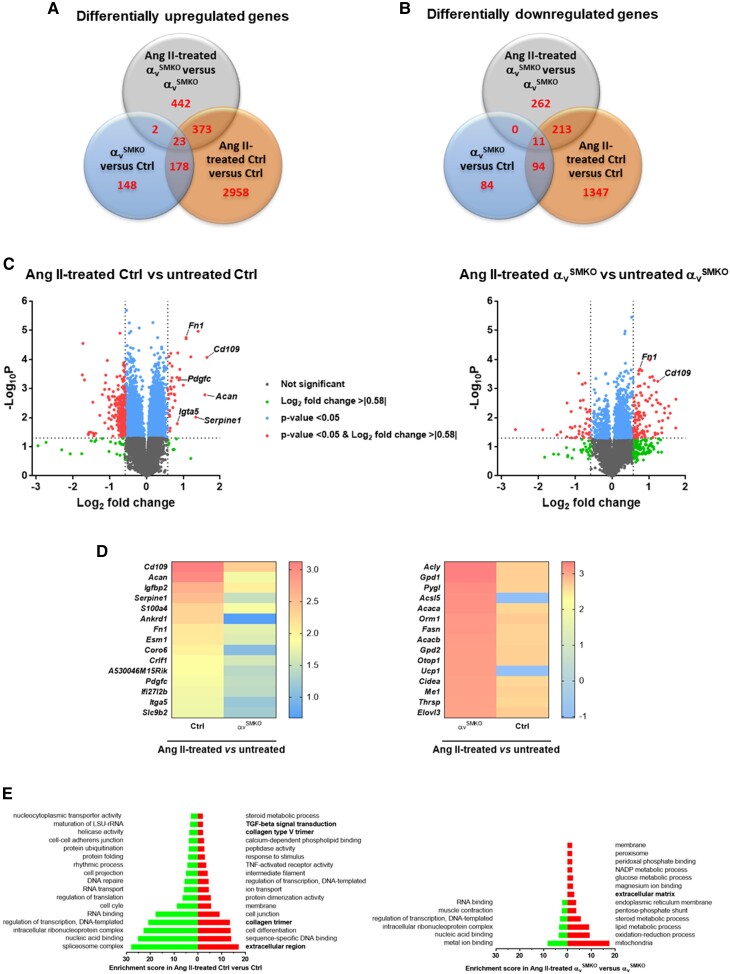
Figure 2.
Transcriptome analysis of thoracic aorta from Ctrl and αvSMKO mice in basal conditions and in response to 4-week Ang II treatment. (A–B) Venn diagram showing the number of genes differentially expressed in αvSMKO vs. Ctrl, Ang II-treated αvSMKO vs. αvSMKO, and Ang II-treated Ctrl vs. Ctrl for upregulated and downregulated genes, respectively. (C) Volcano of plots of comparative of gene expression in Ang II-treated mice. (D) Heatmaps of top 15 differentially upregulated genes. (E) Gene ontology term and pathways enrichment for Ang II-treated Ctrl vs. Ctrl group and Ang II-treated αvSMKO vs. αvSMKO. Left bars indicate downregulated genes and right bars upregulated genes. The terms related to fibrosis (extracellular region, collagen trimer, collagen type V trimer, TGF-b signal transduction) are indicated in bold.

