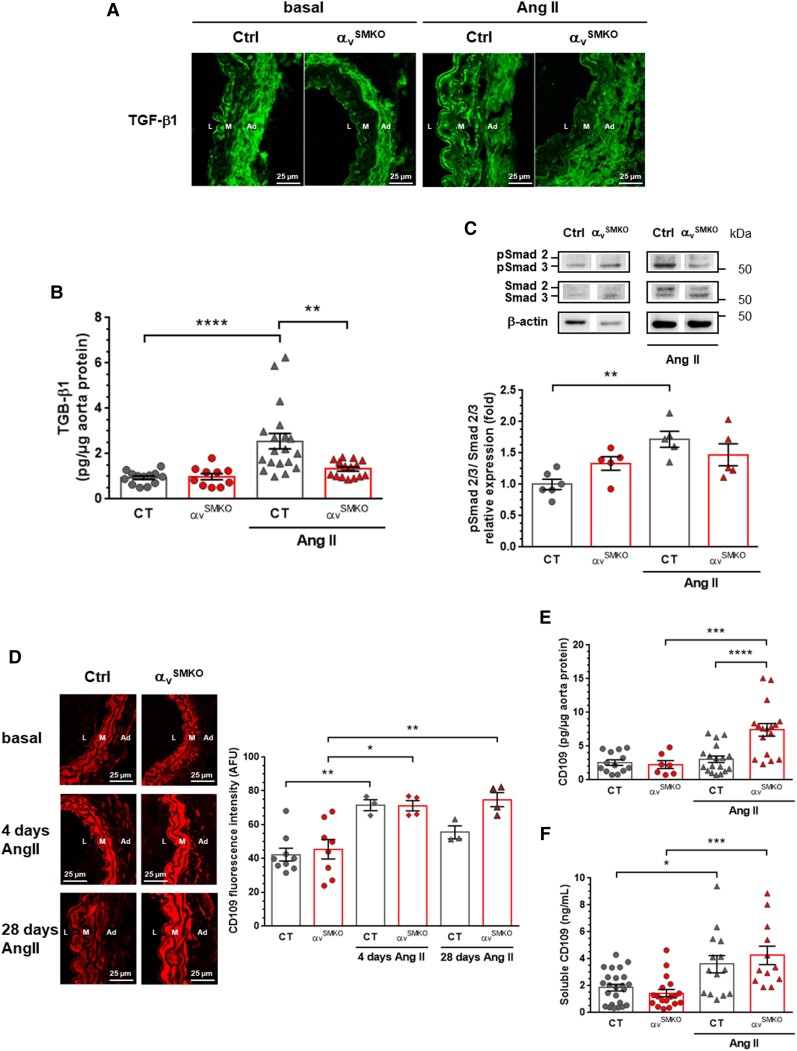
Figure 3.
Decreased TGF-β signalling associated with high CD109 expression in response to Ang II in αvSMKO mice. (A) Representative confocal immunofluorescence images of TGF-β1 in carotid arteries. L, lumen; M, media; Ad, adventitia. (B) TGF-β1 concentration assessed by ELISA (n = 10–19 per group). (C) Western blot analysis of Smad2/3 phosphorylation (n = 5–6 per group). (D) Representative confocal immunofluorescence images of CD109 in carotid arteries and corresponding quantification (n = 3–8 per group). (E and F) CD109 concentration assessed by ELISA in aorta proteins and plasma, respectively (n = 7–24 per group). All data are presented as mean ± SEM. Two-way ANOVA followed by Tukey’s multiple comparisons test was used to analyse multiple group comparisons. **P < 0.01, ***P <0.001, ****P < 0.0001. *P < 0.05, **P < 0.01, ***P < 0.001, ****P < 0.0001.

