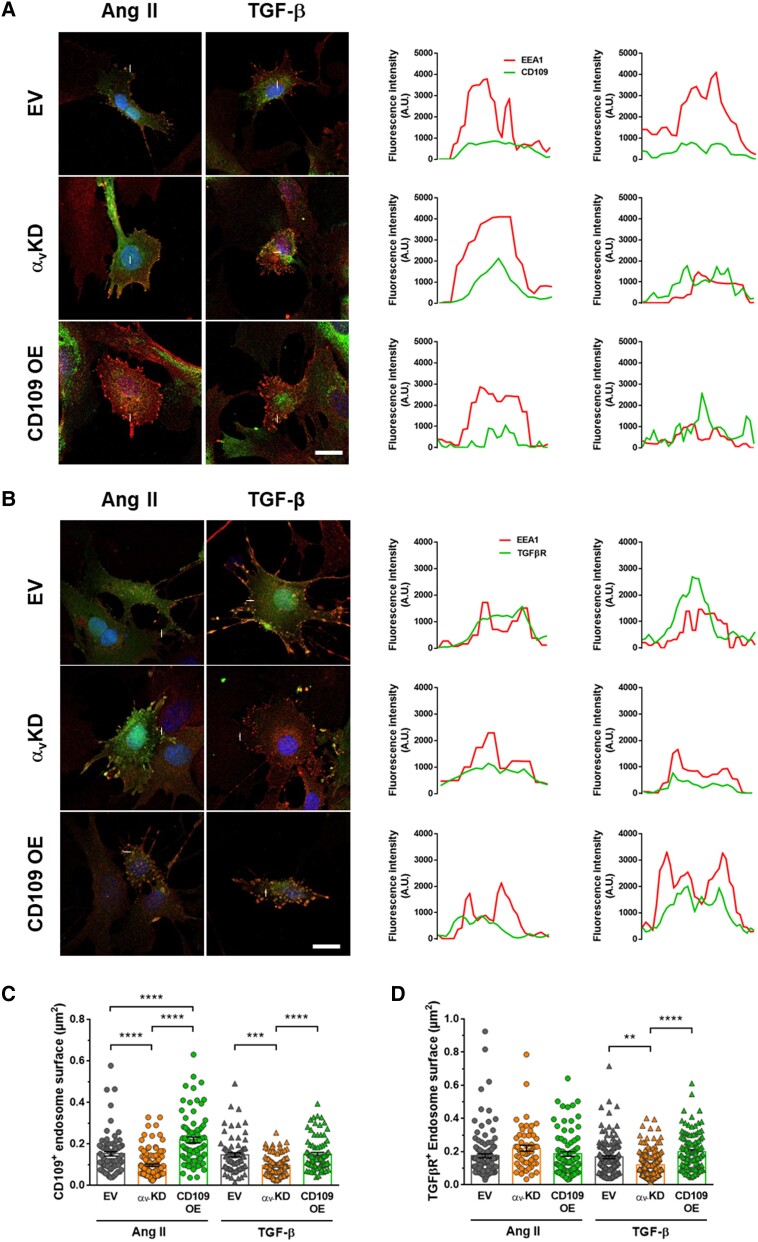
Figure 5.
CD109 and TGF-β receptor colocalization with endosomal EEA1. (A) EEA1 and CD109 immunofluorescent staining. Colocalization of EEA1 and CD109 was assessed by confocal microscopy. The fluorescence profile plot along the line indicated on each image was analysed for each protein (graphics on the right). (B) EEA1 and TGF-β-R immunofluorescent staining. Colocalization of EEA1 and CD109 was assessed by confocal microscopy. (C) EEA1/CD109 endosome surface measured after 15 min of stimulation with Ang II or TGF-β. (D) EEA1/TGF-β-R endosome surface measured after 15 min of stimulation with Ang II or TGF-β. Scale bar: 5 µm. Two-way ANOVA followed by Tukey’s multiple comparisons test was used to analyse multiple group comparisons. **P < 0.01, ***P < 0.001, ****P < 0.0001.

