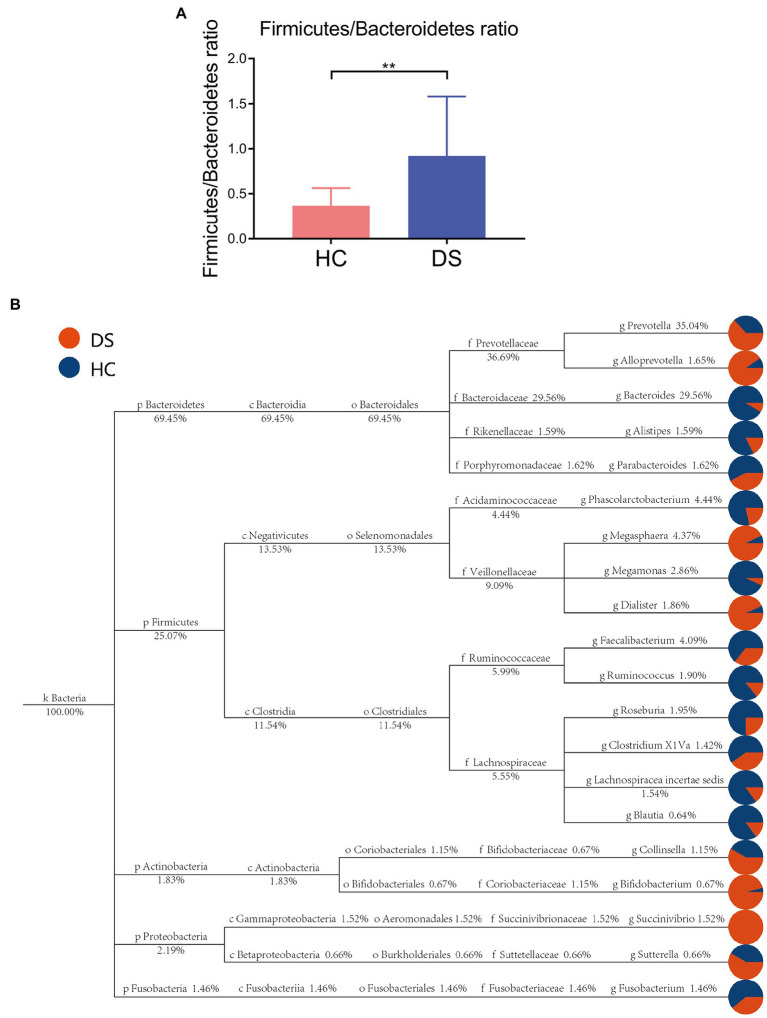
Figure 3.
Taxon-based analysis of the microbiome in the DS and non-DS groups. (A) A significant difference was observed (**p < 0.01) in the ratio of Firmicutes and Bacteroidetes in the intestinal microbiota of the non-DS and DS groups. (B) The classification and abundance of intestinal microbiota from individuals with DS and non-DS volunteers. Different colors represent classification levels, and the size of the circle represents the relative abundance of the classification. The number below the taxonomic name indicates the relative percentage abundance. HC, non-DS volunteers (or non-DS group); DS, individuals with DS (or DS group).

