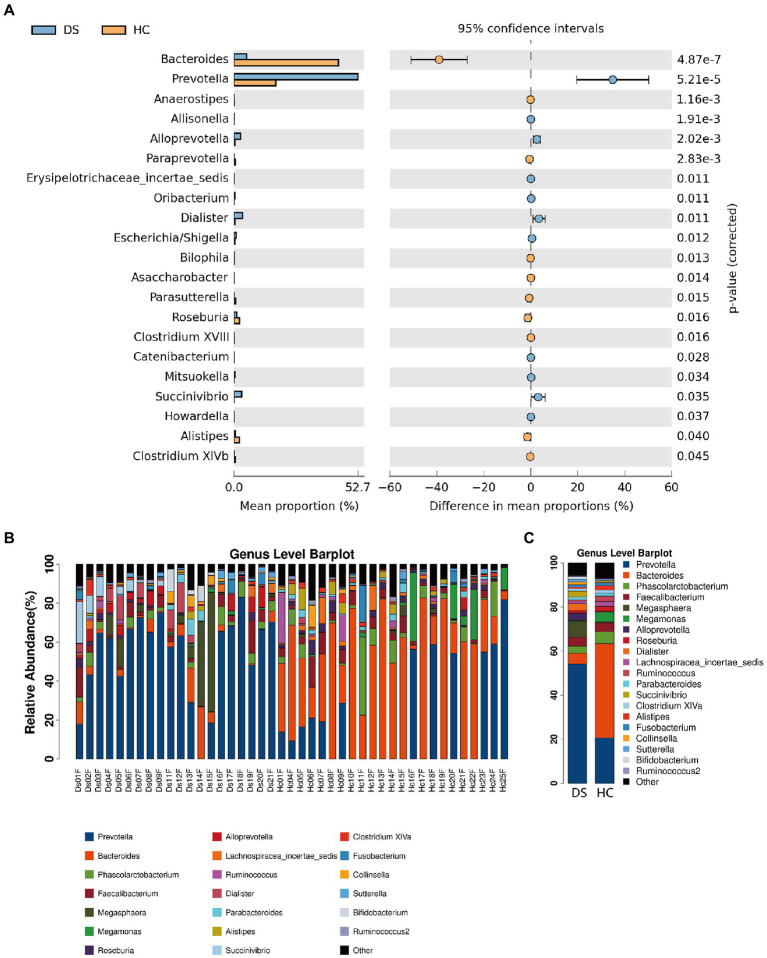
Figure 4.
Differences in microbial composition between individuals with DS (DS) and non-DS volunteers (HC) at the genus level. (A) Mean proportion (left) and difference in mean proportion (right) of each genus present in the microbiome of DS and non-DS groups. (B) Fecal microbial richness of each DS and non-DS volunteer at the genus level. (C) Mean composition and richness of fecal microbiota in individuals with DS and non-DS volunteers.

