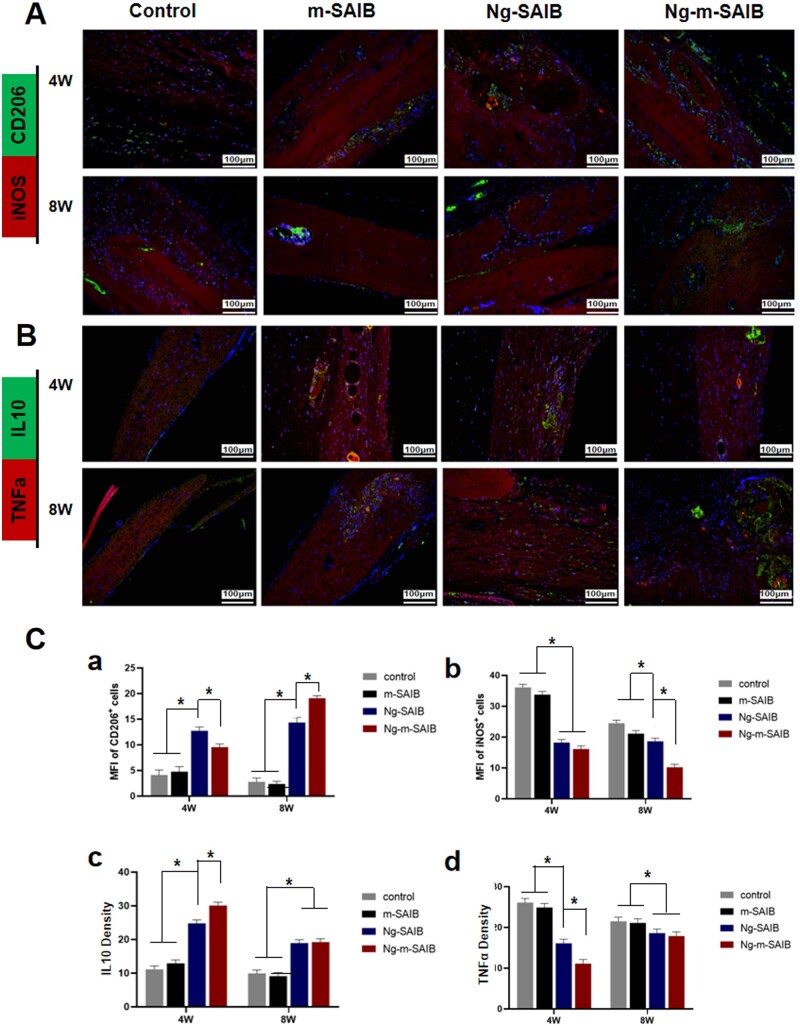
Figure 6.
Immunofluorescence staining results of (A) CD206 and iNOS and (B) IL10 and TNFα at the bone defects in cranial specimens. Scale bar = 100 μm. (C) Mean fluorescence intensity (MFI) of CD206+ cells (a) and iNOS+ cells (b). Quantification of immunofluorescence intensity of IL10 (c) and TNFα (d).

