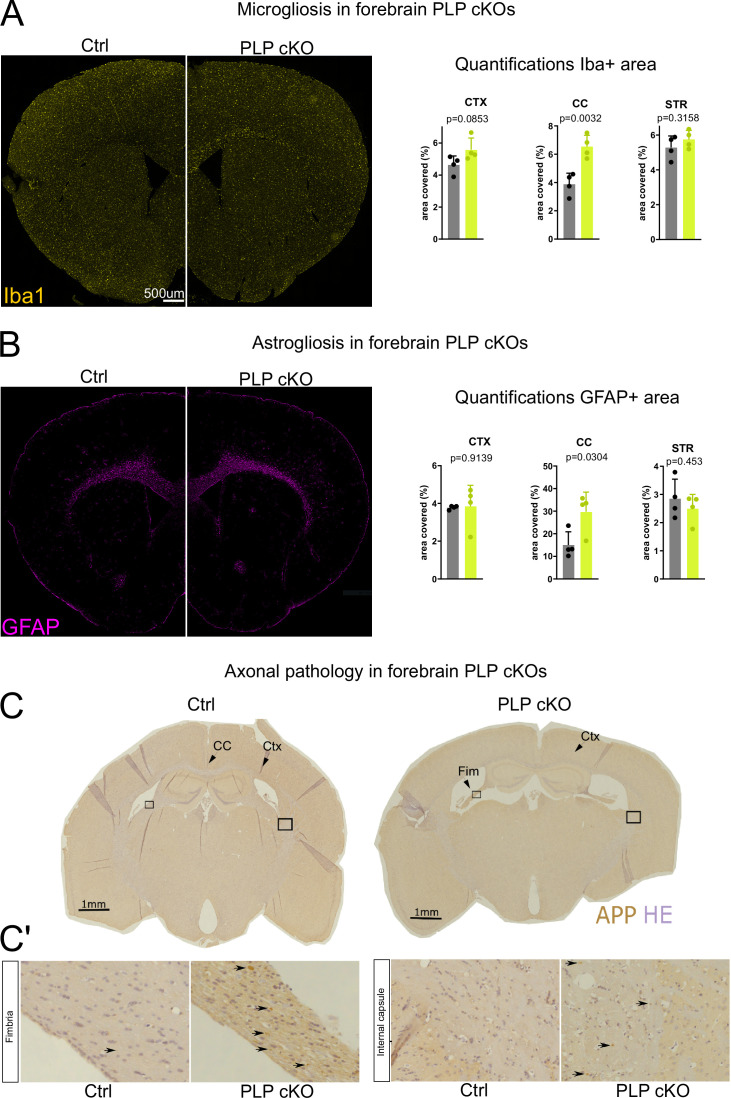
Figure 2. Neuropathological changes in the subcortical white matter in forebrain proteolipid protein (PLP) conditional knockout (cKO) mice.
(A) Immunofluorescent characterization of microgliosis (IBA1 immunolabeling) in forebrain PLP cKO mice (overview coronal brain section). Quantifications for IBA1+area for region of interests (ROIs) (CTX: cortex, CC: corpus callosum, STR: striatum) are shown on the right. Bars represent means ± SEM and datapoints represent individual mice (n=4 per group). For statistical analyses two-sided Student’s t-tests were performed. Age of the animals was 22 months. (B) Immunofluorescent characterization of astrogliosis (GFAP immunolabeling) in forebrain PLP cKO mice (overview coronal brain section). Quantifications for GFAP+area for ROIs (CTX: cortex, CC: corpus callosum, STR: striatum) are shown on the right. Bars represent means ± SEM and datapoints represent individual mice (n=4 per group). For statistical analyses two-sided Student’s t-tests were performed. Age of the animals was 22 months. (C) Immunohistochemical characterization of axonal swellings (amyloid precursor protein [APP] immunolabeling) in forebrain PLP cKO mice (overview coronal brain section). Note the apparent fimbria atrophy and ventricular enlargement in forebrain PLP cKO mice. Age of analysis 22 months. (C’) Closeup images of boxed areas in C. Black arrows indicate axonal spheroids in the fimbria and internal capsule of cKO mice, which are essentially absent in Ctrl mice. Levels of significance were defined as p>0.05 (*), p>0.01 (**) and p>0.001 (***).


