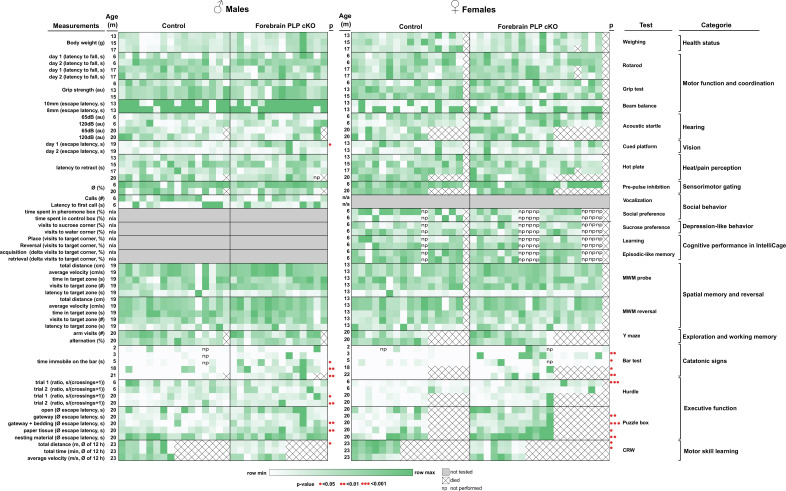
Figure 3. Behavioral deep-phenotyping of male and female forebrain proteolipid protein (PLP) conditional knockout (cKO) mice.
Heatmap representation of behavioral data in the categories of overall health status, motor function and coordination, hearing, vision, heat/pain perception, sensorimotor gating, social behavior, depression-like behavior, cognitive performance in the IntelliCage, spatial memory and reversal in the Morris water maze (MWM), exploration and working memory, catatonic signs and executive function. Each heatmap column represents individual animals (n-numbers). Statistical significance is indicated by red dots. Raw values, n-numbers of mice tested per experiment, mean, SEM, and p-values are specified in Table 1.


