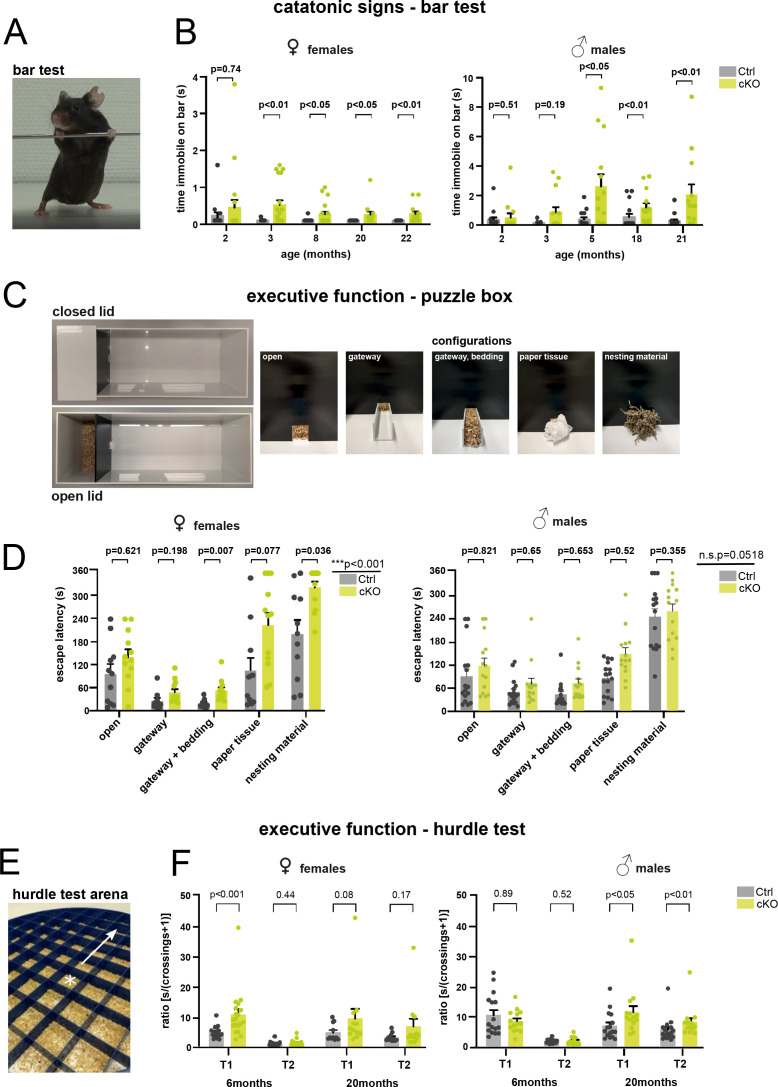
Figure 4. Forebrain proteolipid protein (PLP) conditional knockout (cKO) mice display catatonia-like signs along with impaired executive function.
(A) Representative image of a mouse subjected to the bar test. The time a mouse remains immobile upon placement of its forelimbs on a horizontal bar is measured. (B) Bar test of female and male groups of forebrain PLP cKO (n=12-20 or 13-14, respectively) and Ctrl (n=10-17 or 15-16, respectively) mice were tested at the indicated ages. Bars represent means ± SEM; datapoints represent individual mice. Mann-Whitney U-tests wereperformed for statistical analyses. (C) Puzzle box setup with closed and open lid. The time to escape from a well-lit open space into a dark shelter with increasingly difficult configurations (open entry, addition of a gateway, gateway filled with bedding, entry filled with paper tissue, entry filled with nesting material) is taken as a readout. (D) Female and male groups of forebrain PLP cKO (n=12 or 14, respectively) and Ctrl (n=11 or 16, respectively) mice were assessed at age 20 or 18 months, respectively. Bars represent means ± SEM; datapoints represent individual mice. Repeated measures two-way analysis of variance ( ANOVA); significance level for the factor ‘genotype’ is given on the left; Sidak multiple comparison test was conducted as post hoc test and p-values are given in the graph. (E) Modified hurdle test assessing the escape latency of mice by crossing 5 cm hurdles toward the periphery (arrow) upon placement into the center (marked by a star) of a circular open field arena. (F) Female and male groups of forebrain PLP cKO (n=11-12 or 14, respectively) and Ctrl (n=17-19 or 16, respectively) mice were assessed at the age of 6 and 20 months. trial 1 or 2, T1 or T2. Bars represent mean ± SEM; datapoints represent individual mice. Mann-Whitney U-test was performed for statistical analysis. Levels of significance were defined as p>0.05 (*), p>0.01 (**) and p>0.001 (***). The precise number of mice tested per experiment, mean, SEM, and p-values are specified in Table 1.

