. 2023 Mar 9;12:e84740. doi: 10.7554/eLife.84740

Figure 3. EEG spectral changes, increased sleep state stability, and sleep continuity following CNO injections.

(a) Frontal EEG spectra during NREM sleep following CNO injections relative to saline injections for the acute (first 2 hr, left column) and prolonged (6 hr, right column) observation period. Note the sustained reduction of power in frequency bands >6–8 Hz in the 5 and 10 mg/kg CNO conditions. (b) Transitions between vigilance states in the 6 hr period following saline and CNO injections. Note the increased stability of REM and NREM sleep for the 5 mg/kg CNO (REM>REM: p=0.0192, Cohen’s d=0.73681; NREM>NREM: p=0.0132, Cohen’s d=0.71052) and 10 mg/kg CNO (REM>REM: p=0.0492, Cohen’s d=0.65815; NREM>NREM: p=0.0214, Cohen’s d=0.77396) condition. Solid olive lines indicate significantly increased transitions/continuations of vigilance states in the respective CNO condition compared to the saline condition, dashed grey lines indicate all possible vigilance state transitions/continuations. (c) Cumulative amount of NREM sleep before the first occurrence of REM sleep. (d) Frequency of brief awakenings (4–16 s) per hour of sleep for the first 2 hr after injections. (e) summary of effects of 5 and 10 mg/kg CNO on sleep in DREADD-free mice. n=10 for saline, n=6 for 1 mg/kg, n=10 for 5 mg/kg, n=8 for 10 mg/kg for spectral analysis. n=16 for saline, n=11 for 1 mg/kg, n=15 for 5 mg/kg, n=14 for 10 mg/kg for vigilance state analysis. n=15 for saline, n=11 for 1 mg/kg, n=15 for 5 mg/kg, n=13 for 10 mg/kg for analysis of brief awakenings. Asterisks in panels c and d indicate post hoc comparisons with significant differences (*p<0.05, **p<0.01, ***p<0.001,, ****p<0.001). Asterisks in panel a indicate frequency bins with significant differences in post hoc comparisons using uncorrected paired t-tests (p<0.05) following a significant interaction effect between ‘frequency’ and ‘condition’ in two-way ANOVAs. Data in panel a are presented as the mean ± s.e.m. (shaded areas). ANOVA: analysis of variance. CNO: clozapine-N-oxide. EEG: electroencephalogram. NREM: non-rapid eye movement sleep.

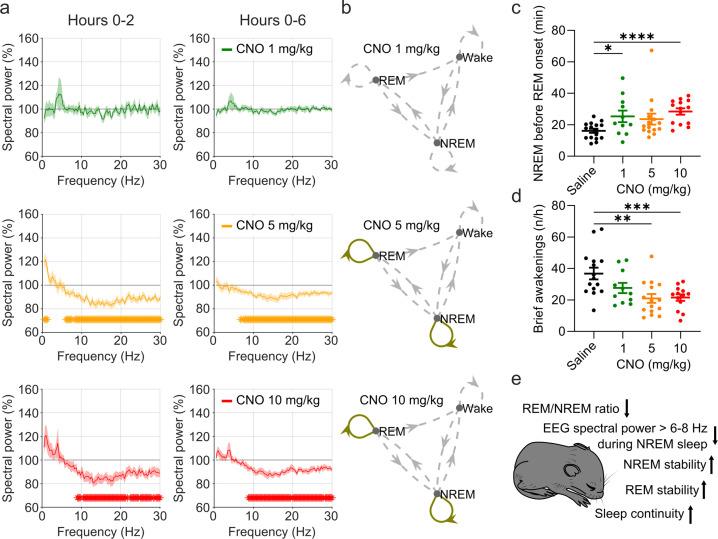
Figure 3.

Figure 3—figure supplement 1. EEG power spectra of wakefulness, NREM, and REM sleep following injections of saline and 1 mg/kg CNO.

Figure 3—figure supplement 1.

Frontal EEG spectra in 0.25 Hz bins between 0.5 and 30 Hz arranged by vigilance state and time window. Two-way ANOVAs revealed a significant interaction effect between ‘frequency’ and ‘condition’ and main effect for ‘frequency’ in the 6 hr REM spectrogram, but no significant main effects for ‘condition’. Frequency bins with significant differences in post hoc tests using uncorrected paired t-tests for α-error probability of p=0.05 are indicated with grey asterisks, for α-error probability of p=0.01 with black asterisks, and using Benjamini-Hochberg (BH) correction for multiple testing with light blue asterisks. n=6 for saline (grey) vs. 1 mg/kg CNO (green) comparison in spectral analysis, n=5 for REM spectral analysis in the 2 hr time window due to the absence of REM sleep in one animal following CNO injection. Data are presented as the mean ± s.e.m. (shaded areas). ANOVA: analysis of variance. CNO: clozapine-N-oxide. EEG: electroencephalogram. NREM: non-rapid eye movement sleep. REM: rapid eye movement sleep.
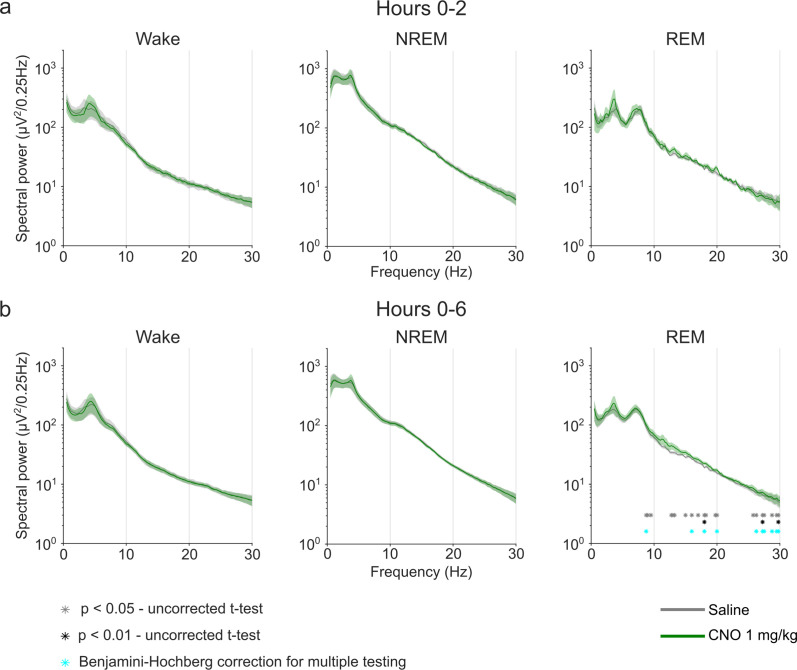
Figure 3—figure supplement 2. EEG power spectra of wakefulness, NREM, and REM sleep following injections of saline and 5 mg/kg CNO.

Figure 3—figure supplement 2.

Frontal EEG spectra in 0.25 Hz bins between 0.5 and 30 Hz arranged by vigilance state and time window. Two-way ANOVAs for NREM sleep spectra revealed a significant interaction effect between ‘frequency’ and ‘condition’ and main effects for ‘condition’ and for ‘frequency’. Frequency bins with significant differences in post hoc tests using uncorrected paired t-tests for α-error probability of p=0.05 are indicated with grey asterisks, for α-error probability of p=0.01 with black asterisks, and using Benjamini-Hochberg (BH) correction for multiple testing with light blue asterisks. Note the systematic increase of slow frequencies (0–1.25 Hz) in the first 2 hr and the suppression of spectral power in higher frequencies (6.25–30 Hz) in the NREM sleep spectrogram both in the first 2 hr and over the entire observation period. n=10 for saline (grey) vs. 5 mg/kg CNO (orange) comparison in spectral analysis, n=9 for REM spectral analysis in the 2 hr time window due to the absence of REM sleep in one animal following CNO injection. Data are presented as the mean ± s.e.m. (shaded areas). ANOVA: analysis of variance. CNO: clozapine-N-oxide. EEG: electroencephalogram. NREM: non-rapid eye movement sleep. REM: rapid eye movement sleep.
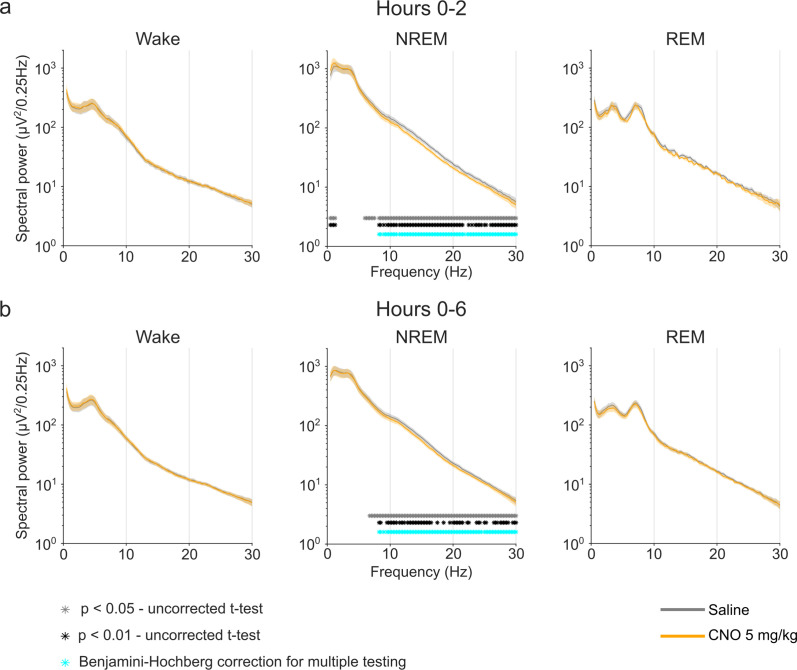
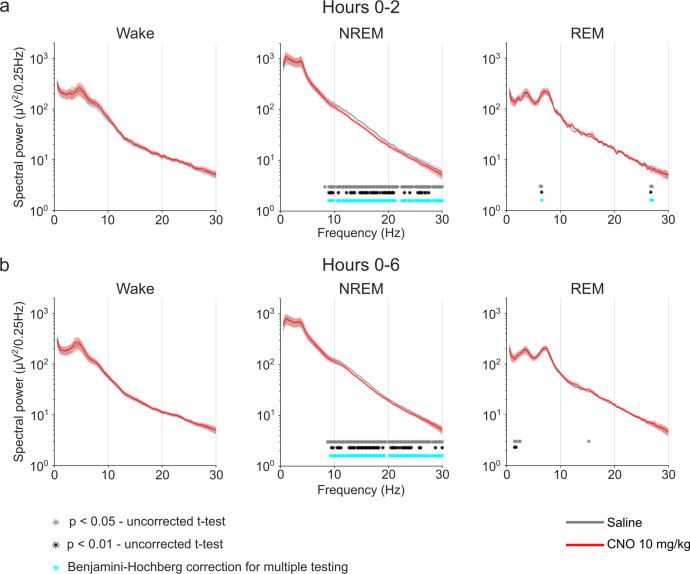
Figure 3—figure supplement 3. EEG power spectra of wakefulness, NREM, and REM sleep following injections of saline and 10 mg/kg CNO.

Figure 3—figure supplement 3.

Frontal EEG spectra in 0.25 Hz bins between 0.5 and 30 Hz arranged by vigilance state and time window. Two-way ANOVAs for NREM sleep spectra revealed a significant interaction effect between ‘frequency’ and ‘condition’ and main effects for ‘condition’ and for ‘frequency’. Two-way ANOVAs for REM sleep spectra also revealed a significant interaction effect between ‘frequency’ and ‘condition’ and a significant main effect for ‘frequency’, but no significant main effects for ‘condition’. Frequency bins with significant differences in post hoc tests using uncorrected paired t-tests for α-error probability of p=0.05 are indicated with grey asterisks, for α-error probability of p=0.01 with black asterisks, and using Benjamini-Hochberg (BH) correction for multiple testing with light blue asterisks. Note the suppression of spectral power in higher frequencies (8.75–30 Hz) in the NREM sleep spectrogram both in the first 2 hr and over the entire observation period. n=8 for saline (grey) vs. 10 mg/kg CNO (red) comparison in spectral analysis. Data are presented as the mean ± s.e.m. (shaded areas). ANOVA: analysis of variance. CNO: clozapine-N-oxide. EEG: electroencephalogram. NREM: non-rapid eye movement sleep. REM: rapid eye movement sleep.