. 2023 Mar 9;12:e84740. doi: 10.7554/eLife.84740

Figure 5. Effects of C21 on sleep architecture, NREM sleep spectra, sleep state stability, and sleep continuity resemble the effects of CNO.

(a) NREM sleep architecture and (b) REM sleep architecture for the 6 hr observation period following C21 injections. (c) Frontal EEG spectra during NREM sleep relative to saline injections for the acute (first 2 hr, dark blue) and full (6 hr, light blue) observation period following C21 injections. Asterisks indicate frequency bins with significant differences in post hoc comparisons using uncorrected paired t-tests (p<0.05; acute: dark blue, full: light blue) following a significant interaction effect between ‘frequency’ and ‘condition’ in two-way ANOVAs. (d) Transitions between vigilance states in the 6 hr period following saline and C21 injections. Note the increased stability of REM and NREM sleep (REM>REM: p=0.0144, Cohen’s d=1.0325; NREM>NREM: p=0.0384, Cohen’s d=0.81527). Solid olive lines indicate significantly increased transitions/continuations of vigilance states in the C21 condition compared to the saline condition, dashed grey lines indicate all possible vigilance state transitions/continuations. (e) Cumulative amount of NREM sleep before the first occurrence of REM sleep. (f) Frequency of brief awakenings (4–16 s) per hour of sleep for the first 2 hr after injections. Number of animals n=7 mice for vigilance state analysis in panels a, b, d, and e. For analysis of EEG NREM spectra in panel c and brief awakenings in panel f: n=6 mice. Asterisks in panels a, b, e, and f indicate t-tests with significant differences (*p<0.05, **p<0.01, ***p<0.001). Data in c are presented as the mean ± s.e.m. (shaded areas). ANOVA: analysis of variance. C21: compound 21. EEG: electroencephalogram. NREM: non-rapid eye movement sleep. REM: rapid eye movement sleep.

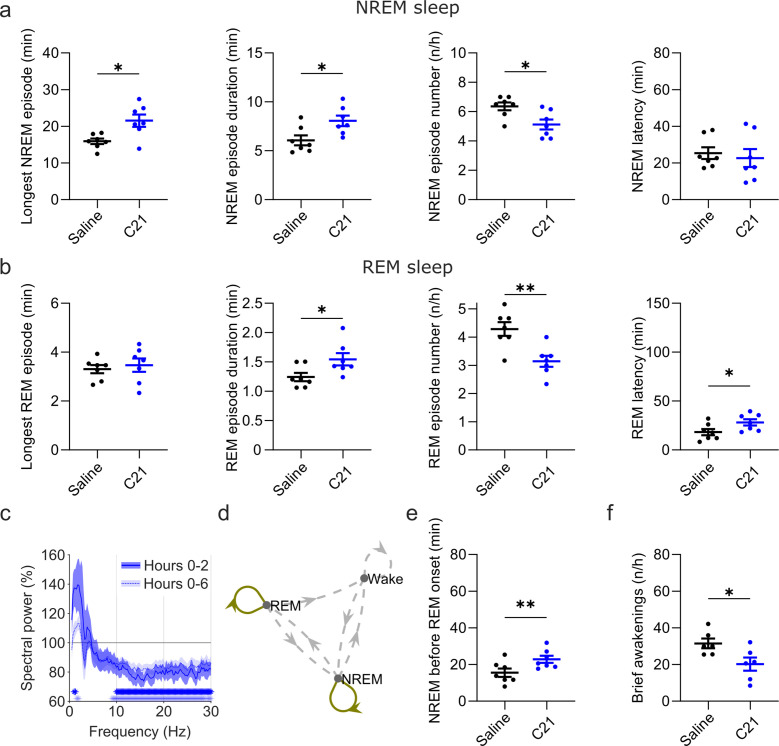
Figure 5.

Figure 5—figure supplement 1. EEG spectral analysis of NREM sleep following injections of saline and 3 mg/kg C21.

Figure 5—figure supplement 1.

(a) Frontal EEG spectra in 0.25 Hz bins between 0.5 and 30 Hz for the acute (first 2 hr, left) and full (first 6 hr, right) observation time window. For the 2 hr time window, the two-way ANOVA revealed an interaction effect between ‘condition’ and ‘frequency’ (F(118,590)=2.961, p<0.0001), but the main effect of ‘condition’ did not reach statistical significance (F(1,5) = 6.560, p=0.0506). In the 6 hr time window, there was an interaction effect between ‘condition’ and ‘frequency’ (F(118, 590)=4.726, p<0.0001) as well as a main effect of ‘condition’ (F(1,5) = 10.32, p=0.0237). Both ANOVAs also revealed a main effect of ‘frequency’. Frequency bins with significant differences in post hoc tests using uncorrected paired t-tests for α-error probability of p=0.05 are indicated with grey asterisks, for α-error probability of p=0.01 with black asterisks, and using Benjamini-Hochberg (BH) correction for multiple testing with light blue asterisks. (b) Frontal EEG spectra during NREM sleep following C21 injections relative to saline injections for the acute (first 2 hr, left) and prolonged (6 hr, right) observation period. Frequency bins with significant differences in uncorrected paired t-tests for α-error probability of p=0.05 are indicated with grey asterisks. n=6 for saline (grey) vs. 3 mg/kg C21 (blue). Data are presented as the mean ± s.e.m. (shaded areas). ANOVA: analysis of variance. C21: compound 21. EEG: electroencephalogram. NREM: non-rapid eye movement sleep. REM: rapid eye movement sleep.
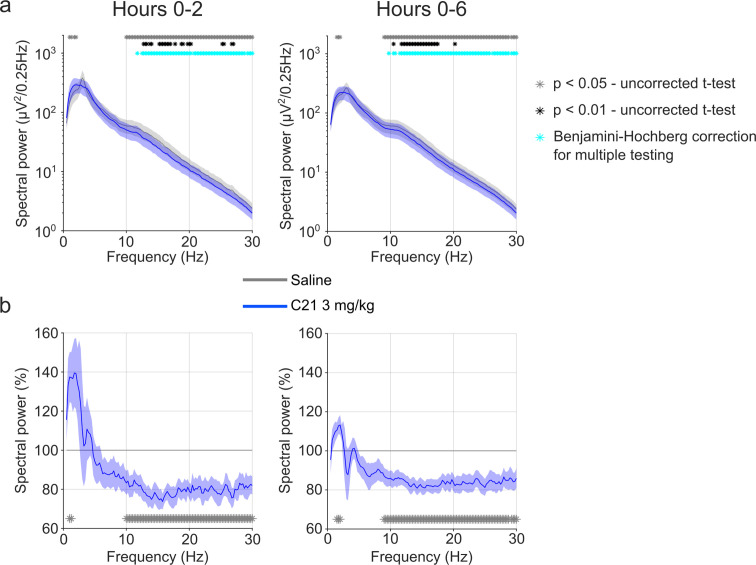
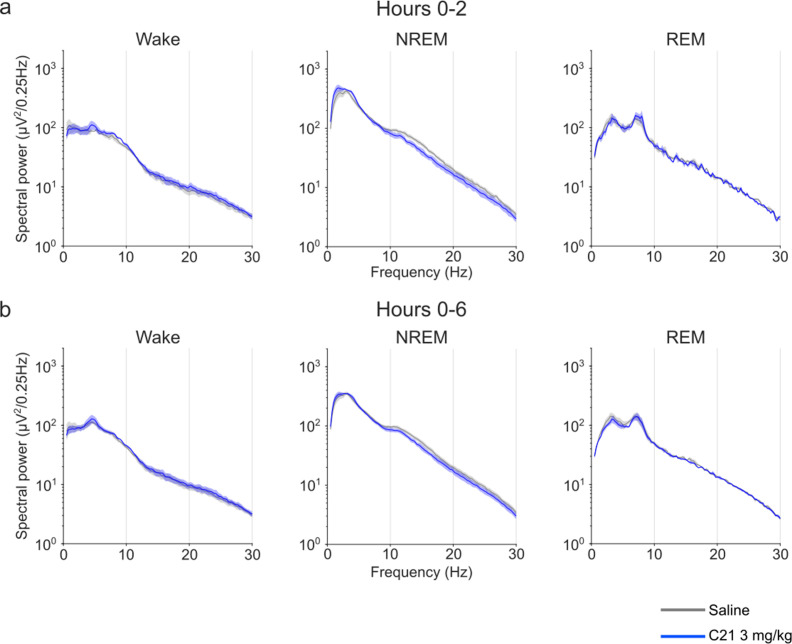
Figure 5—figure supplement 2. EEG power spectra of wakefulness, NREM, and REM sleep following injections of saline and 3 mg/kg C21.

Figure 5—figure supplement 2.

Frontal EEG spectra in 0.25 Hz bins between 0.5 and 30 Hz arranged by vigilance state and time window. Note that due to the low number of suitable animals n=3 for the wake condition (because of movement artefacts in the EEG) no null-hypothesis testing was performed and the data are only presented for qualitative assessment. Data for all three vigilance states are only presented for n=3 to maintain the within-subject comparison. Data are presented as the mean ± s.e.m. (shaded areas). C21: clozapine-N-oxide. EEG: electroencephalogram. NREM: non-rapid eye movement sleep. REM: rapid eye movement sleep.