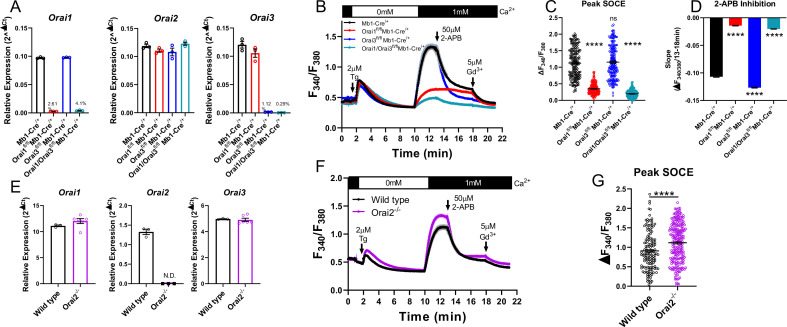
Figure 5. Orai1 and Orai3 synergistically mediate store-operated Ca2+ entry (SOCE) in primary B cells.
(A) Quantitative RT-PCR of Orai1, Orai2, and Orai3 mRNA in negatively isolated B cells from B cell-specific Orai knockout mice (n=3 biological replicates per genotype). (B) Measurement of SOCE in naïve B cells with Fura2 upon store depletion with 2 µM thapsigargin in 0 mM Ca2+ followed by re-addition of 1 mM Ca2+ to the external bath solution. Subsequently, SOCE was inhibited with the addition of 50 µM 2-APB at 13 min followed by 5 µM Gd3+ at 18 min. (C) Quantification of peak SOCE in (B) (from left to right n=200, 200, 199, and 149 cells; Kruskal-Wallis test with multiple comparisons to Mb1-Cre/+). (D) Quantification of the rate of 2-APB inhibition from 13 to 18 min. (E) Quantitative RT-PCR of Orai1, Orai2, and Orai3 mRNA in negatively isolated B cells from wild-type and Orai2-/- mice (n=3 and six biological replicates). (F) Measurement of SOCE in naïve B cells with Fura2 from wild-type and Orai2-/- mice. (G) Quantification of peak SOCE in (F) (n=147 and 240 cells; Mann-Whitney test). All scatter plots are presented as mean ± SEM. For all figures, ***p<0.001; ****p<0.0001; ns, not significant.


