. 2023 Feb 21;12:e84708. doi: 10.7554/eLife.84708

Figure 8. Orai1 and Orai3 regulate B cell mitochondrial respiration.

(A) Gene set enrichment analysis (GSEA) of the KEGG Oxidative Phosphorylation gene set in B cells stimulated for 24 hr with anti-IgM (20 μg/mL) relative to unstimulated controls. (B) Representative transmission electron microscopy (TEM) images of B cells from Mb1-Cre/+ mice. Shown are naïve, unstimulated B cells (top) and B cells stimulated for 24 hr with anti-IgM (bottom). (C) Quantification of total mitochondria per cell in unstimulated B cells and B cells stimulated for 24 hr with anti-IgM (n=25 for each; Mann-Whitney test). (D) Measurement of total mitochondrial content with MitoTracker Green in B cells from Mb1-Cre/+ and Orai1fl/fl Mb1-Cre/+ mice following 24 hr stimulation (n=3 biological replicates for each; Mann-Whitney test). (E) Measurement of oxygen consumption rate (OCR) in primary B lymphocytes following 24 hr stimulation with anti-IgM (20 μg/mL) using the Seahorse Mito Stress Test. (F) Energy map of maximal oxygen consumption rates (OCR) and extracellular acidification rates (ECAR) following carbonyl cyanide p-trifluoromethoxyphenylhydrazone (FCCP) addition. (G, H) Quantification of basal (G) and maximal (H) respiration from Seahorse traces in (E) (n=4 biological replicates for each genotype; one-way ANOVA with multiple comparisons to Mb1-Cre/+). All scatter plots and Seahorse traces are presented as mean ± SEM. For all figures, **p<0.01; ****p<0.0001; ns, not significant.

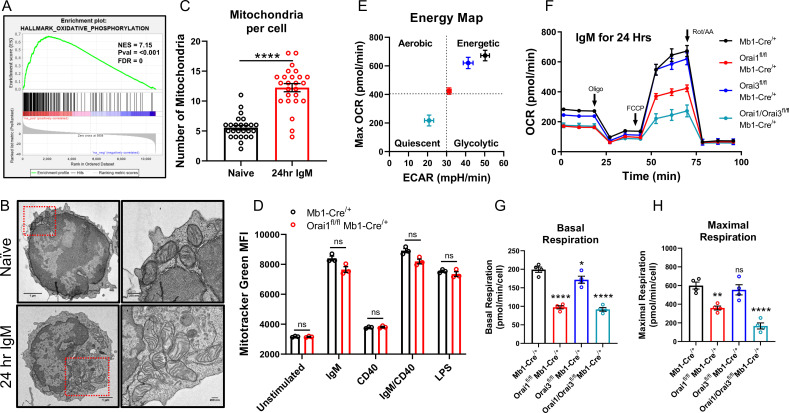
Figure 8—source data 1. Source data for GSEA summary statistics for Figure 8.
Figure 8—source data 2. Source data for Figure 8.

Figure 8.

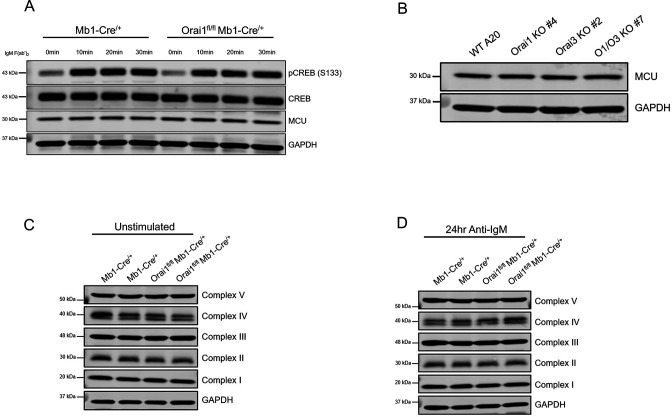
Figure 8—figure supplement 1. Loss of Orai1 does not alter CREB phosphorylation, MCU expression, or expression of electron transport chain proteins.

Figure 8—figure supplement 1.

(A) Western blot analysis of total and phosphorylated CREB (S133), MCU, and GAPDH in isolated B cells from Mb1-Cre/+ and Orai1fl/fl Mb1-Cre/+ mice. B cells were either unstimulated or stimulated with anti-IgM (20 μg/mL) for 10, 20, or 30 min before harvesting. (B) Western blot analysis of MCU and GAPDH protein in single Orai1, and Orai3 knockout and double Orai1/Orai3 knockout A20 cell clones. (C, D) Western blot analysis of electron transport chain components in B cells from Mb1-Cre/+ and Orai1fl/fl Mb1-Cre/+ mice either (C) unstimulated or (D) stimulated with anti-IgM for 24 hr.
Figure 8—figure supplement 1—source data 1. Labeled western blots for Figure 8—figure supplement 1.
Figure 8—figure supplement 1—source data 2. Raw unedited uncropped blots for GAPDH and MCU from Figure 8—figure supplement 1A.
Figure 8—figure supplement 1—source data 3. Raw unedited uncropped blots for Phospho-CREB (pCREB) from Figure 8—figure supplement 1A.
Figure 8—figure supplement 1—source data 4. Raw unedited uncropped blots for MCU and GAPDH from Figure 8—figure supplement 1B.
Figure 8—figure supplement 1—source data 5. Raw unedited uncropped blots for electron transport chain (ETC) proteins from Figure 8—figure supplement 1C.
Figure 8—figure supplement 1—source data 6. Raw unedited uncropped blots for GAPDH from Figure 8—figure supplement 1C.
Figure 8—figure supplement 1—source data 7. Raw unedited uncropped blots for electron transport chain (ETC) proteins and GAPDH from Figure 8—figure supplement 1D.