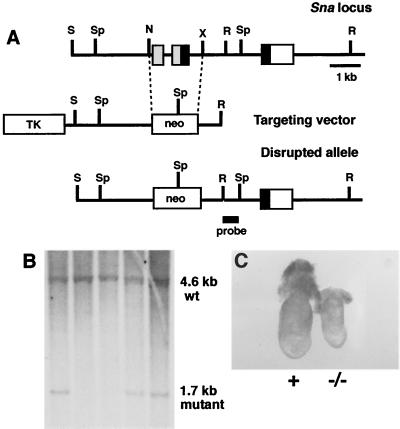
FIG. 1.
Targeted disruption of the mouse Sna gene. (A) Targeting scheme. The upper line shows the genomic organization of the Sna gene (14). The three exons are indicated by boxes. The region encoding the amino terminus of the Sna protein is indicated by gray boxes, the region encoding the zinc fingers is indicated by black boxes, and the 3′ untranslated region is indicated by a white box. The middle line represents the structure of the targeting vector. The lower line represents the predicted structure of the Sna locus following homologous recombination of the targeting vector. The probe used for Southern blot analysis is indicated. N, NruI; R, EcoRI; S, SalI; Sp, SphI; X, XbaI; TK, thymidine kinase. (B) DNAs isolated from targeted ES cells were digested with SphI, blotted, and hybridized with the indicated probe. Wild-type (wt) and mutant hybridization bands are indicated. Three independently targeted ES cell clones are shown. (C) Whole-mount morphology of a Sna−/− embryo (right) and a control littermate embryo (left) at E7.5. In all figures, normal littermate embryos were either Sna+/− or Sna+/+ and are indicated with a plus sign.

