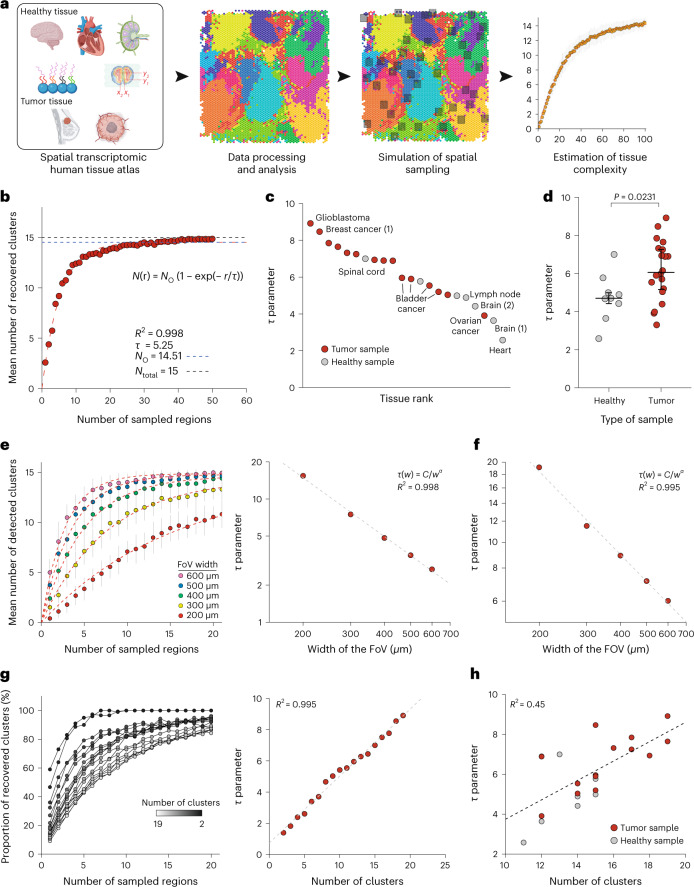
Fig. 1. Use of spatial transcriptomic data to determine the optimal tissue sampling strategy for multiplexed imaging.
a, Analytical workflow used to simulate IMC of human tissues using spatial transcriptomic data. b, Number of recovered clusters versus number of sampled regions for a bladder cancer Visium dataset with 400-µm FoVs. Each point corresponds to the mean number of recovered clusters across 50 similar simulations and vertical bars correspond to standard error. The red dashed line corresponds to the fitted function. The horizontal dashed lines correspond to the total number of observed clusters (No; blue) and the actual number of clusters (Ntotal; gray). c, Plot of τ for indicated samples from healthy and tumor samples. Numbers in brackets correspond to the number of sample when multiple samples are available for a tissue. d, Comparison of τ values from healthy (n = 7) and tumor samples (n = 15). The P value was computed using a two-sided Mann–Whitney rank test. Large bars correspond to the median and small bars to the interquartile range (IQR). e, Left, mean number of clusters recovered versus number of sampled regions for FoV widths ranging from 200 to 600 µm for the cerebellum Visium sample. Each point corresponds to the mean number of recovered clusters across 50 similar simulations and vertical bars correspond to the standard error. Red dashed lines correspond to individual fits for each w value. Right, relationship between τ and w for cerebellum sample. The dashed line corresponds to the linear regression after log10 transform. f, Relationship between τ and w for the glioblastoma Visium sample. The dashed line corresponds to the linear regression after log10 transform. g, Left, proportion of clusters recovered as a function of τ for a glioblastoma sample for indicated number of clusters. Each point corresponds to the mean number of recovered clusters across 50 similar simulations. For the sake of clarity, the error bars and fitted curves are not displayed. Right, relationship between τ and the number of clusters for a glioblastoma sample. The dashed line corresponds to a linear regression. h, Relationship between τ and the number of clusters for all studied samples. The dashed line corresponds to a linear regression. Source data for this figure are provided.

