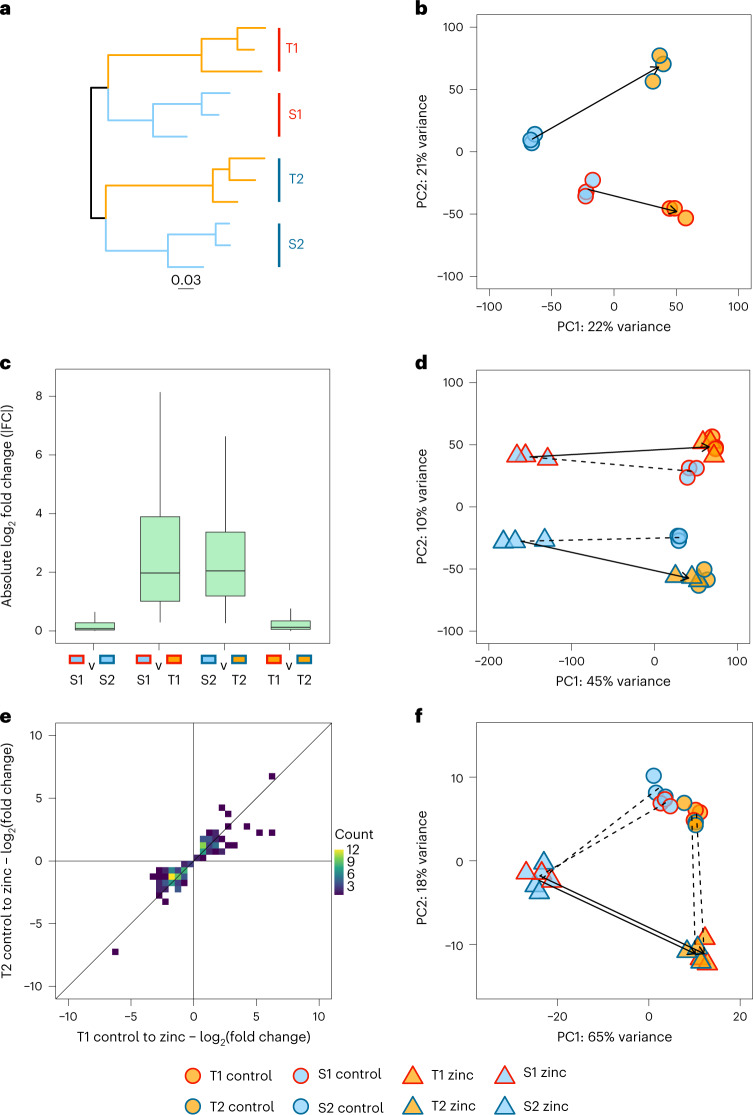
Fig. 1. Parallel constitutive and plastic changes in tolerant populations.
a, Independent origins of the tolerant populations: a maximum-likelihood phylogenetic tree based on 15,285 SNPs; all inter-population relationships had bootstrap support ≥99%. b, PCA of variance-stabilizing transformed counts (Methods) of all 27,970 genes for all populations in the control treatment, summarizing constitutive expression differences between populations. Point fill corresponds to zinc tolerance (orange, tolerant; blue, sensitive); point border corresponds to geographic pair (red, Wales (T1/S1); dark blue, England (T2/S2)). Arrows are drawn from the centroid of susceptible populations (S1 and S2) to the centroid of corresponding tolerant populations (T1 and T2, respectively). c, For CEC genes, boxplot of absolute values of log2-transformed fold changes (|FC|; y axis) between pairs of populations (x axis) in the control treatment (box, interquartile range; line, median; whiskers, the largest value no further than 1.5× the interquartile range). N = 413 for each box. Values above/below whiskers not plotted. d, PCA of variance-stabilizing transformed counts in both treatments across all genes. Point fill and border as in b. Circles correspond to control treatment, triangles to zinc treatment. Dashed line, plastic change; solid arrow, evolutionary change. e, Heat map of log2-transformed shrunken fold changes between control and zinc treatments for genes that were differentially expressed between control and zinc in both T1 (x axis) and T2 (y axis; that is, DP genes). f, PCA of variance-transformed counts for DP genes only, in both treatments (legend as in b).

