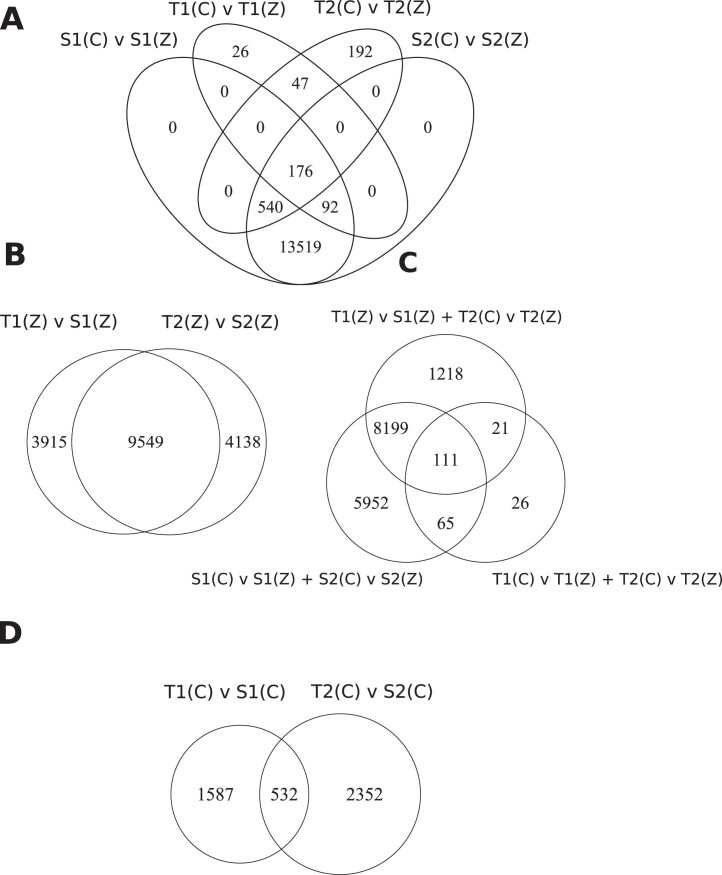
Extended Data Fig. 1. Overlaps between sets of differentially expressed genes.
Venn diagrams outlining the numbers of significantly differentially expressed genes for a given comparison (separated by a ‘v’). T1/S1/T2/S2 correspond to populations, (C) corresponds to control conditions, (Z) to zinc conditions: for example, T1(C) v S1(C) refers to genes differentially expressed between T1 in the control, and S1 in the control. A ‘+’ corresponds to genes that fulfil both sets of criteria: for example, T1 (C) v T1 (Z) + T2 (C) v T2 (Z) corresponds to the set of genes that are differentially expressed between both (i) T1 in the control vs. T1 in the zinc, and (ii) T2 in the control vs. T2 in the zinc. Panels illustrate (A) between treatment expression changes within populations, and their overlaps, (B) between ecotype-changes in the zinc in the two geographic groups, and their overlap, (C) the overlap between genes differentially expressed in both tolerant populations between conditions, both susceptible populations between conditions, and between both ecotype pairs within the zinc treatment, and (D) between-ecotype changes in the control in the two geographic groups, and their overlap.

