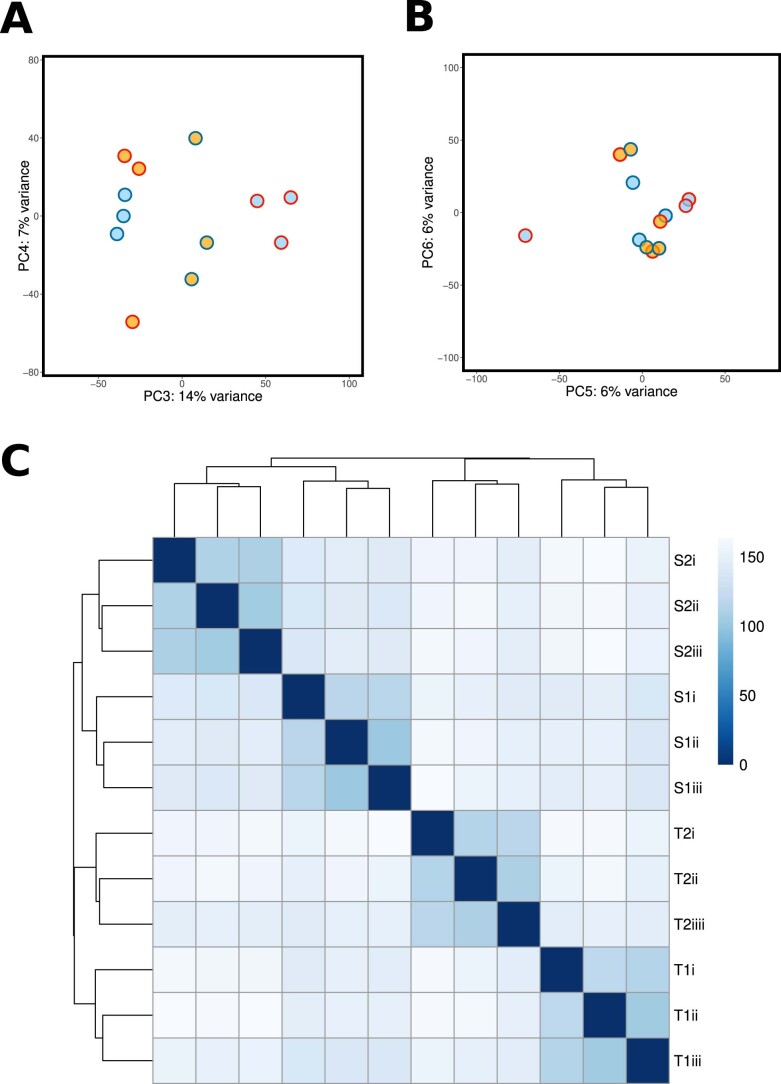
Extended Data Fig. 2. Gene expression variation in control conditions.
Within-control variation of counts transformed with a variance-stabilising transform of all genes included in differential expression analysis, for all populations in control treatments, are displayed. A + B) Principal components analysis (PCA), point fill corresponds to population zinc tolerance (orange = tolerant, blue = sensitive), point border corresponds to geographic pair (red = Wales [T1/S1], dark blue = England [T2/S2]). The third and fourth (A), and fifth and sixth (B) principal components are displayed. (C) A heatmap and hierarchical clustering of all individuals in the control treatment based on a matrix of transformed counts. Each individual (i-iii) from each population (S1, S2, T1, T2) is displayed as a row/column. Box colours indicate sample-to-sample distances based on the R dist() function.

