
Extended Data Fig. 5. Convergent gene expression in derived plasticity genes.
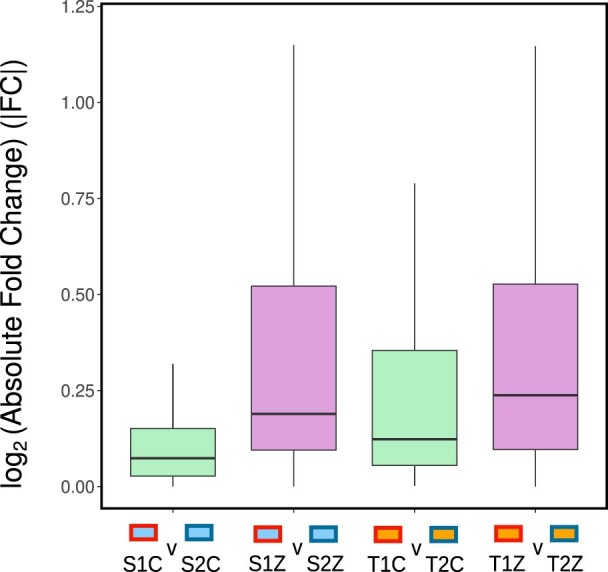
Boxplots of absolute values of log2 transformed fold changes (|FC|; y axis) between pairs of populations (x axis) for adaptive plasticity genes, either in the control (green) or zinc (purple) conditions. Box encompasses 25th to 75th percentiles, line corresponds to median. Whiskers correspond to the largest value no further than 1.5x the interquartile range from either the 25th or 75th percentiles. N = 137 for each boxplot. Points beyond the whiskers not shown.