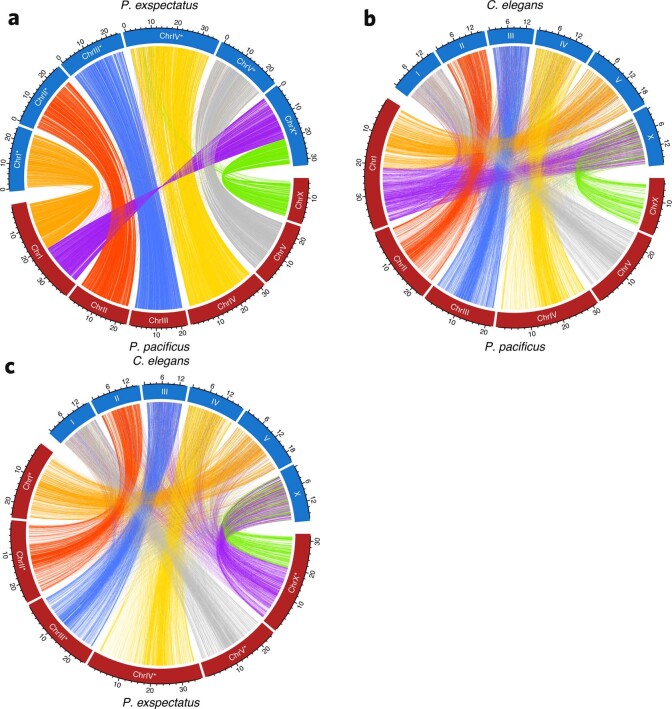
Extended Data Fig. 4. Circos plot of protein-based homologous loci.
a, P. pacificus vs. P. exspectatus. b, P. pacificus vs. C. elegans. c, P. exspectatus vs. C. elegans. One-to-one orthologs were identified based on protein sequence homology. Position of one-to-one orthologs in two genomic sequences are shown as links. The colors of the links indicate different chromosomal regions in P. pacificus (a, b) or P. exspectatus (c). The genomic regions ChrIL, ChrIR, and ChrX (left and right of 21.05 Mb of ChrI and ChrX of P. pacificus or ChrI* and left and right of 20.00 Mb of ChrX* of P. exspectatus, respectively) are shown in different colors (orange, purple and green, respectively).

