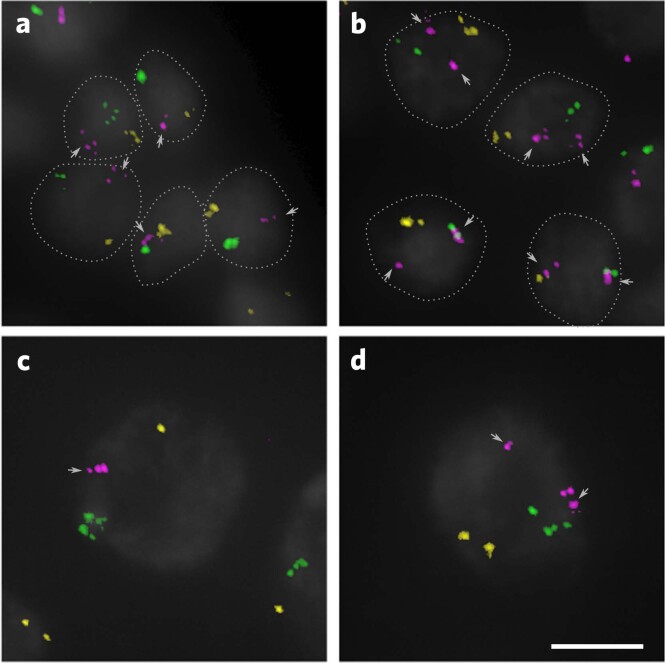
Extended Data Fig. 9. FISH analysis of meiotic cells of BC1 females with the specific 21-mer of the three elements, ChrIL (yellow), ChrIR (magenta), and ChrX (green).
Earlier (a, b) and later (c, d) stage of Prophase I cells of different individuals are shown. DAPI staining is shown in grey. a, b, single nuclei are circled by dotted lines. The arrow indicates the cluster of signals of ChrIR. The additional FISH signals of ChrIR were distantly located in 3 out of 10 individuals (e. g. b, d), whereas only one cluster was found in the others (e. g. a, c). Such a variation did not happen with ChrIL and ChrX. These pictures were obtained in the Z-stack projection. The scale bar is 5 µm.

