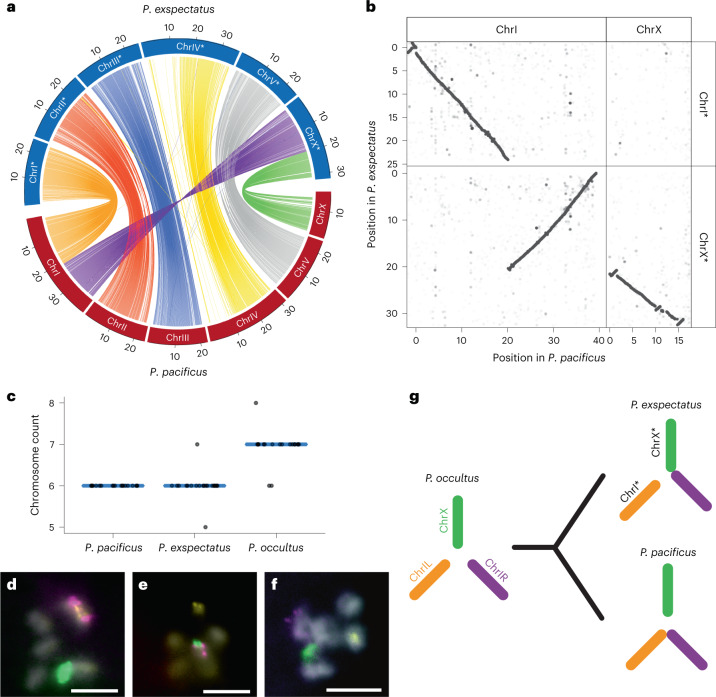
Fig. 2. De novo assembly of P. exspectatus genome and karyotype analysis indicate two independent chromosome fusion events.
a, Circos plot of nucleotide-based homologous loci between P. pacificus and P. exspectatus. The 100 kb sliding windows with more than 10% homologous sequence are shown as links. The colours reflect chromosomal regions in P. pacificus. The ChrIL and ChrIR (left and right of chromosome I 21.05 Mb, respectively) are shown in different colours (orange and purple, respectively). b, Dot plot of nucleotide-based homologous loci of chromosomes involved in the large interchromosomal rearrangement. Homologous single nucleotides downsized by 1/100 are plotted. c, Chromosome count of spermatocyte prophase I of three species. P. pacificus, N = 19; P. exspectatus, N = 21; P. occultus, N = 19. The mode is shown as a blue line. d–f, FISH mapping of prophase I spermatocyte of P. pacificus (d), P. exspectatus (e) and P. occultus (f) with the specific 21-mer of the three elements: ChrIL (yellow), ChrIR (magenta) and ChrX (green). 4,6-Diamidino-2-phenylindole (DAPI) staining is shown as grey. The scale bars are 5 µm. g, Karyotype evolution between the three investigated species.

