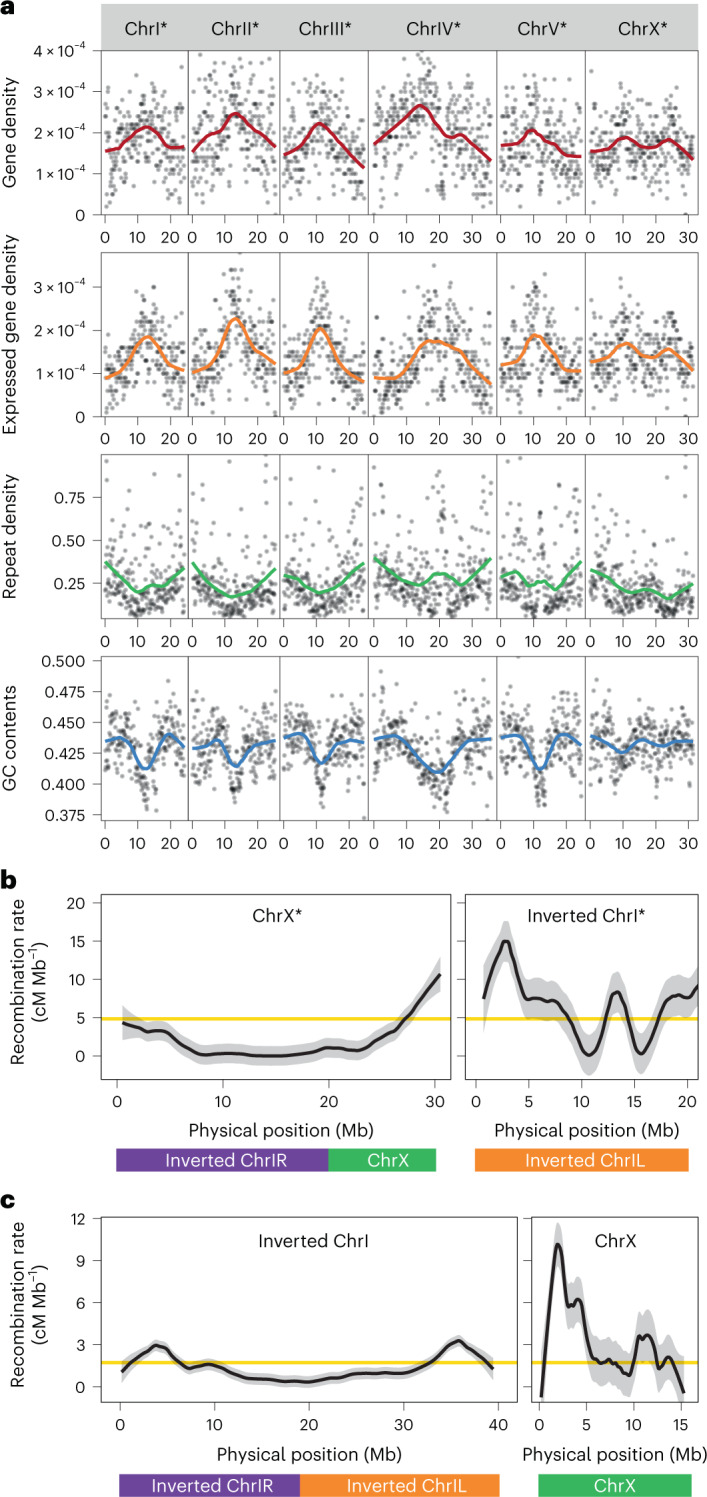
Fig. 3. Repatterning of recombination rate in association with chromosome fusions.

a, Genome statistics of the P. exspectatus genome. Plots indicate statistics of 100 kb sliding window. Coloured lines indicate LOESS fitting curve with span = 0.4. The number of genes over the sequence length was defined as gene density. Expressed gene density indicates the density of genes with non-zero median transcripts per million. The proportion of repeat-masked regions with RepeatScout pipeline was defined as repeat density. b, Recombination-rate pattern of the three elements ChrIL, ChrIR and ChrX in P. exspectatus. c, Recombination-rate pattern of the three elements ChrIL, ChrIR and ChrX in P. pacificus. ChrI or ChrI* was inverted to compare the corresponding coordinates between two species. The homologous region of the three elements is shown in the bar at the bottom. The recombination rates between neighbouring genetic markers were fitted to LOESS curve with span = 0.2 and are shown in black lines with the 95% confidence intervals shown as a grey ribbon. The average recombination rate across the genome is shown with yellow lines.
