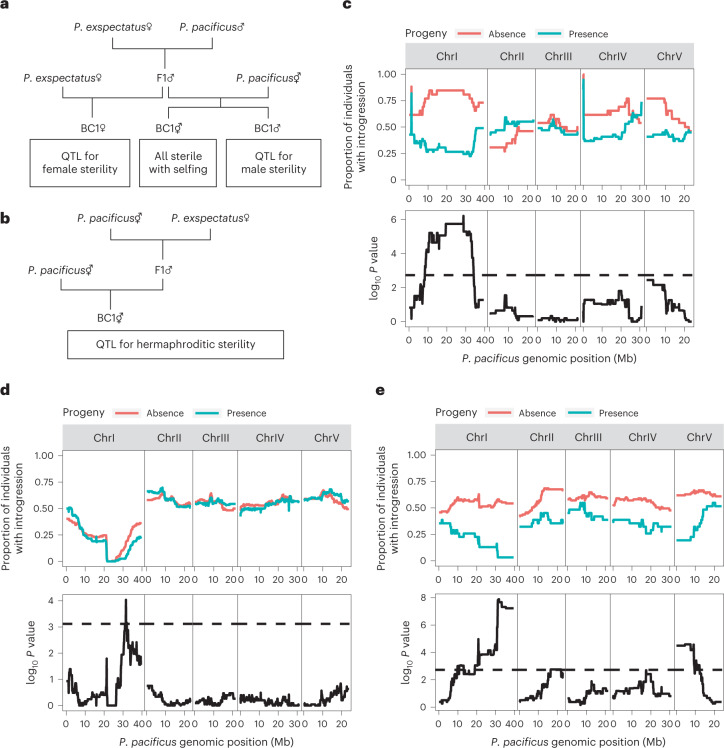
Fig. 4. QTL study of hybrid sterility of different sexes identify major QTL at the chromosome fusion.
a,b, Crossing scheme for the QTL analysis for female and male sterility (a) and hermaphrodite sterility (b). c–e, Results of QTL analysis for female (c), male (d) and hermaphrodite (e) sterility. Upper rows indicate proportion of individuals with introgression of each 100 kb sliding window for individuals with at least one progeny (green) or no progeny (red). In the lower rows, the log10 P value of Fisher’s exact test of association of fertility and introgression is shown as solid line. Significant threshold of P value of the Fisher’s exact test calculated by permutation test (N = 1,000, significant level = 1%) is shown as dashed line.

