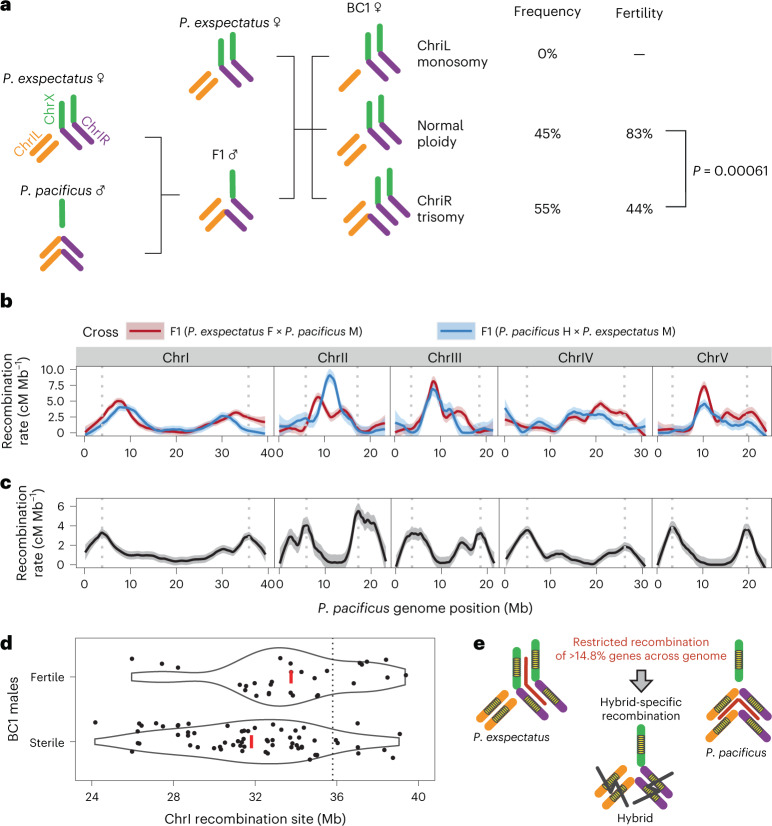
Fig. 5. Multiple effects of chromosome fusions on the evolution of hybrid sterility.
a, Chromosomal fusions induced trisomy that is associated with hybrid female sterility. The P value of Fisher’s exact test is shown (see also Supplementary Table 5). b,c, Genomic pattern of recombination rate of the interspecies (b) and intraspecies (c) F1 individuals. BC1 male genotype data were used for the recombination rates of F1 of P. exspectatus females versus P. pacificus males (red in b), while BC1 hermaphrodite genotype data were used for the recombination rates of F1 of P. pacificus hermaphrodite versus P. exspectatus males (blue in b). RILs data of P. pacificus strains PS312 versus RSB001 were used for the intraspecies recombination rate (black in c). The recombination rates between neighbouring genetic markers were fitted to LOESS curve with span = 0.2 and are shown in solid lines with the 95% confidence intervals shown as light-coloured ribbons. The grey vertical dotted lines show the peak of recombination rate at both chromosome ends in the intraspecies hybrid meiosis. d, Association between shifted recombination rate and BC1 male sterility. Violin plot for recombination sites between BC1 males with presence/absence progeny. The plots indicate the distribution of recombination sites of BC1 males having recombination in the region. The red line shows the mean position of recombination sites. The dotted line indicates the peak of recombination rate of P. pacificus. e, Hybrid-specific recombination-breaking gene combination of low-recombination regions surrounding chromosome fusions.

