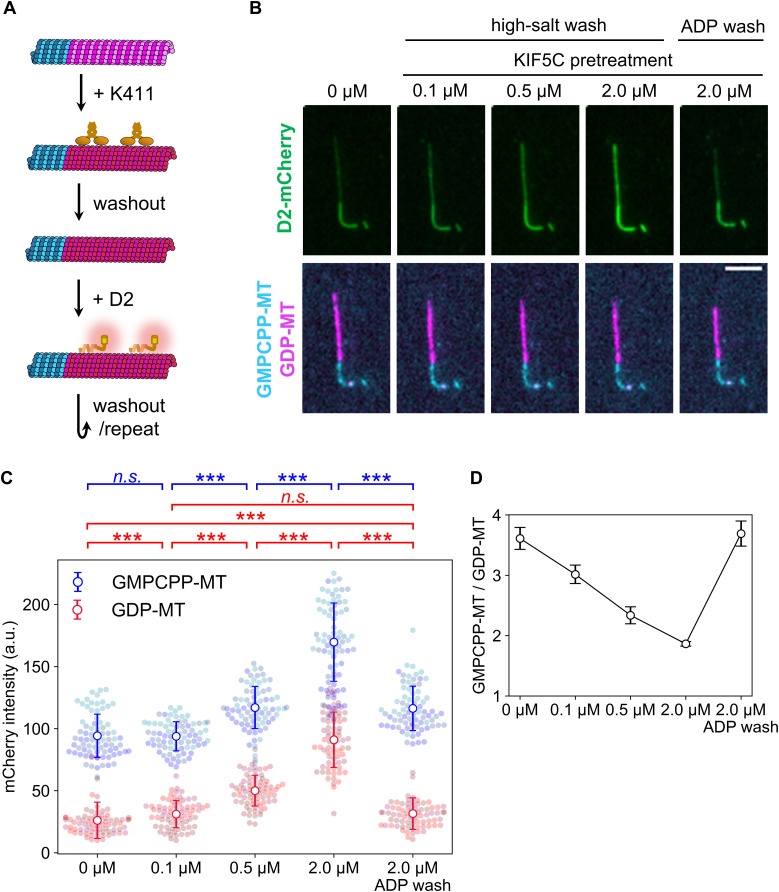
Figure 3. Microtubule expansion by KIF5C pretreatment promotes D2 binding.
(A) Overview of the KIF5C pretreatment assay. Coloring is the same as in Fig 1B except for the expanded GDP-MT lattice shown in red. KIF5C was added to induce microtubule expansion and washed out before applying D2. (B) Representative images after adding D2. Contrasts are set to the same values for each channel. Scale bar, 5 μm. (C) Quantification of D2-mCherry fluorescence intensity on microtubules. Colors indicate different replicates. Error bars, S.D. ***P < 0.001 (Steel–Dwass test); n.s., not significant. Sample size of each data set is summarized in Table 2. (D) Binding specificity of D2. Specificity was calculated as the mCherry intensity ratio on GMPCPP-MT to that on GDP-MT. (C) Error bars are the standard error predicted by pairs of standard errors in (C) and the error propagation rule.

