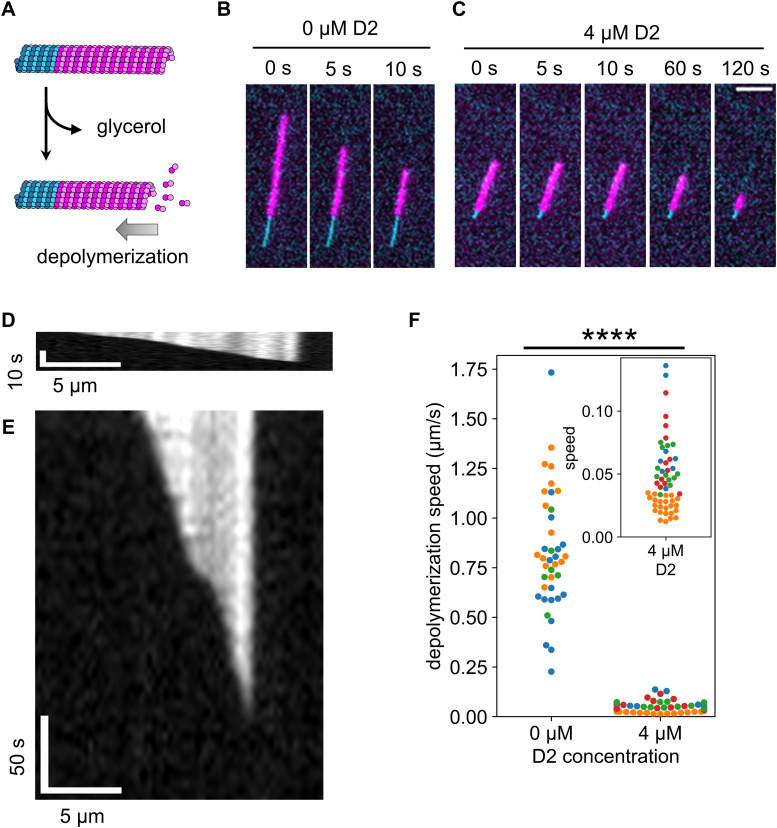
Figure 5. Microtubule depolymerization was suppressed by D2 binding.
(A) Schematic illustration of the assay. Microtubule depolymerization was induced by replacing the buffer with glycerol-free buffer. (B, C) Representative frames during depolymerization without D2 (B) or with 4 μM of D2 (C). The cyan channel image (GMPCPP seed) was taken only at the first frame so that the same image was used for each frame. Scale bar, 5 μm. (B, C, D, E) Kymographs of the microtubules in (B, C), respectively, depolymerizing without D2 (D) or with 4 μM D2 (E). Because the images were taken at different time intervals, two kymographs were resized to fit the same time scale. (F) Microtubule depolymerization speed. Different colors represent different replicates. 0 μM: 0.82 ± 0.30 μm/s (mean ± S.D., 40 microtubules, three replicates); 4 μM: 0.046 ± 0.028 μm/s (mean ± S.D., 56 microtubules, four replicates). ****P < 0.0001 (Welch’s t test).

